


Content ITV PRO
This is Itvedant Content department
Cleaning and Structuring Retail Data Using Tables
Task Scenario
Welcome to your role as a Junior Data Analyst at DMart Retail Analytics Team.
Today, your reporting manager from the Business Reporting and Merchandising Team has assigned you a master data standardization project.
The latest sales dataset received from multiple DMart stores is currently in a raw and inconsistent format. Before it can be used in the monthly category performance dashboard, it must be professionally cleaned and converted into a reporting-ready structure.
The business team has reported the following issues:
As a Junior Data Analyst, your responsibility is to clean, organize, and standardize the raw DMart dataset so that it is accurate, consistent, and ready for reporting. You need to ensure that product names, values, and business labels follow one standard format, while also correcting any incorrect or inconsistent entries before the file is used for dashboards and business analysis.
Pre-Lab Preparation
git pull origin branchNameGit Pull
Topic : Autofill Magic and Custom List
1) Autofill Series and Flash Fill
2) Creating and Using Custom List
Task 1: Convert Raw Data into an Excel Table
Your first goal is to convert the raw dataset into a professional reporting table so the analytics team can work with it in a more structured and efficient way. Tables make the data easy to access, improve readability, automatically include new rows, reduce reporting errors, and help dashboards connect faster and more reliably.
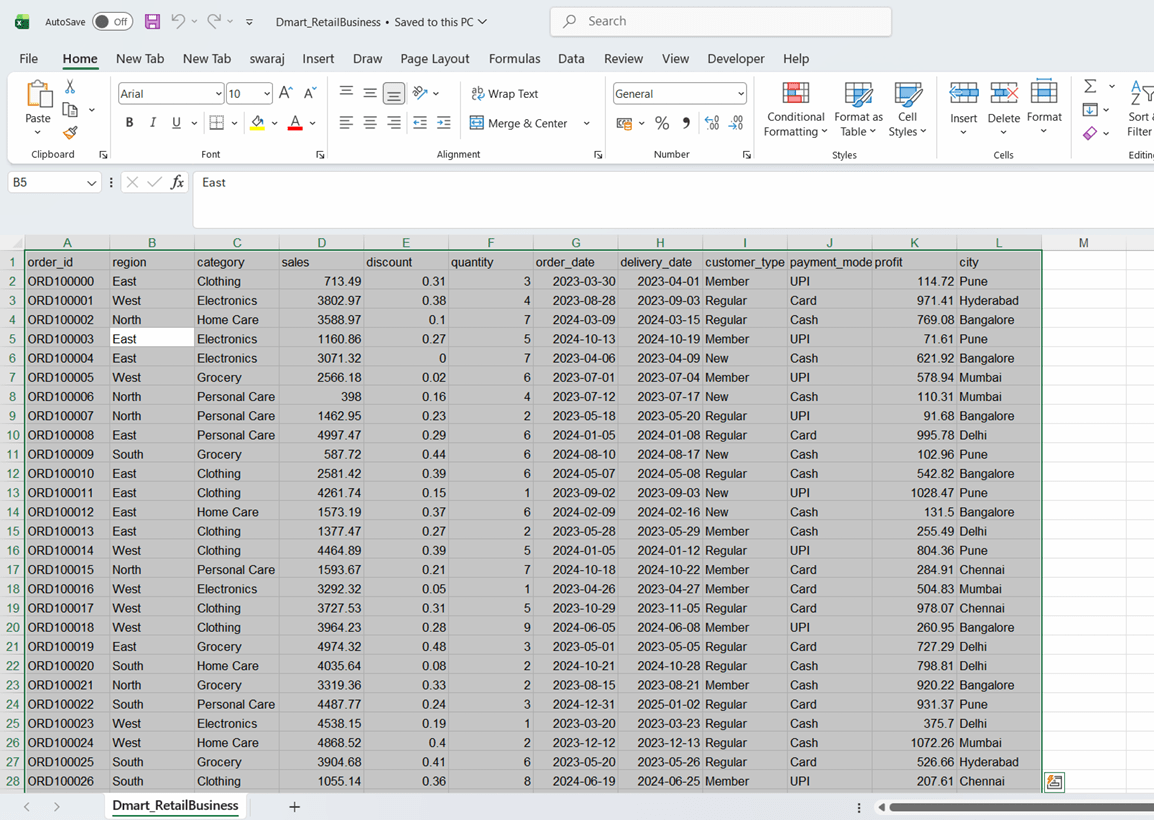
Open the excel sheet and click anywhere inside the dataset and press Ctrl + A to quickly select the complete sales data before converting it into a professional table.
Click to download BRD : DMart_Retail_dataset.xlsx - Google Sheets
1
Selecting Complete Dataset
2
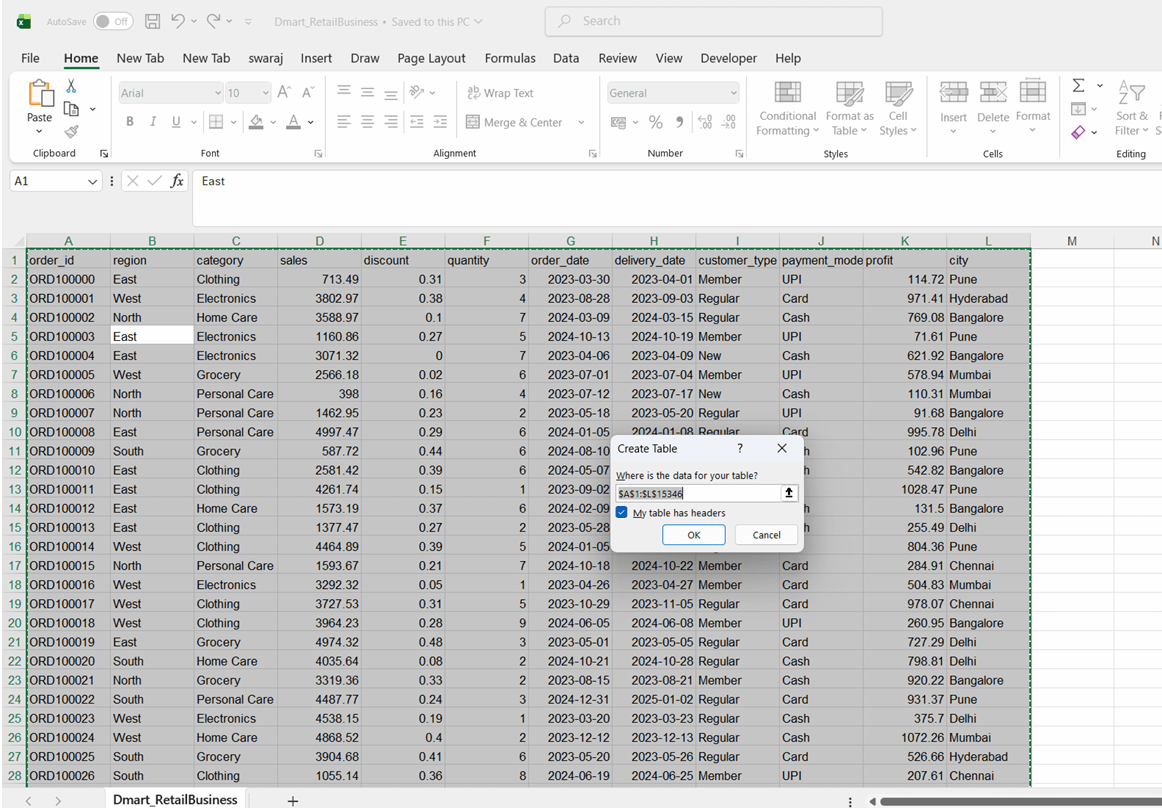
Create Table
Now press Ctrl + T and click ok to quickly create a table.
a
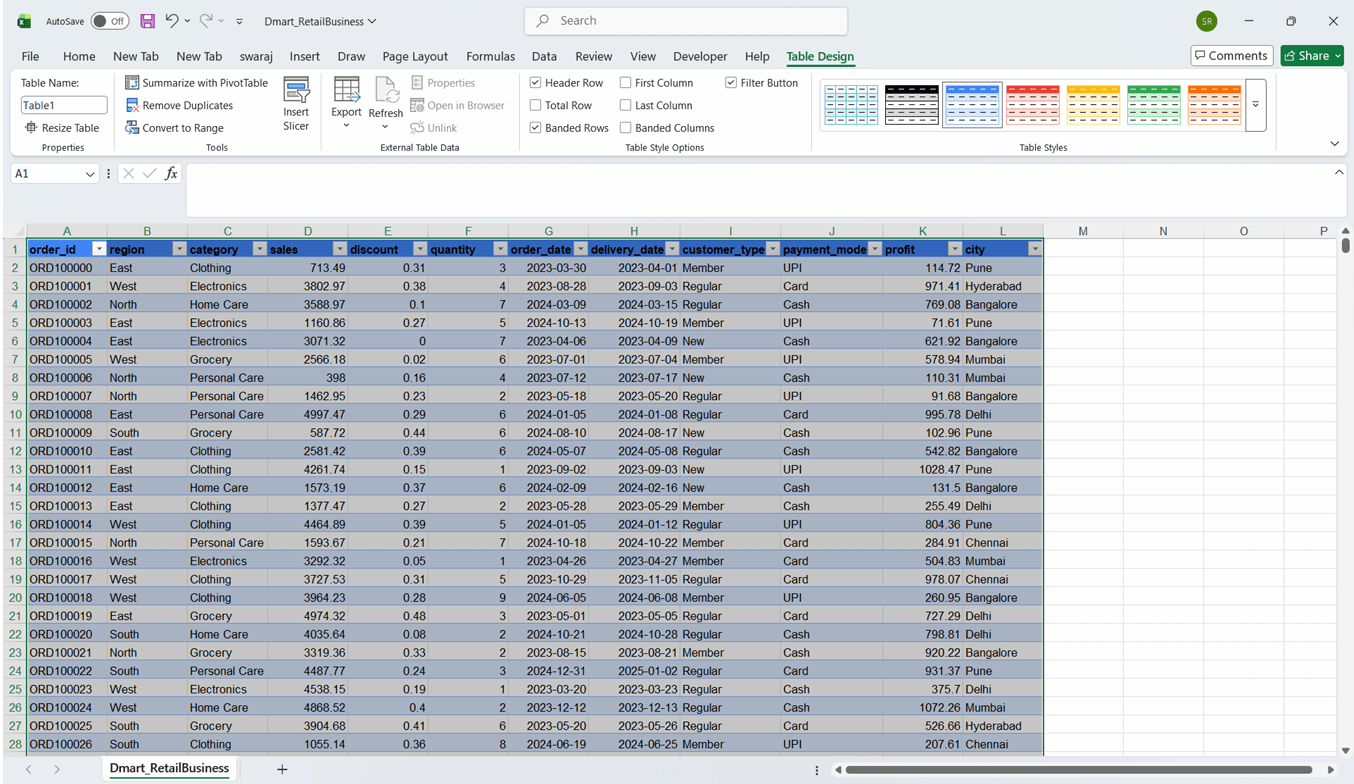
You will now see the data is structured in Table format.
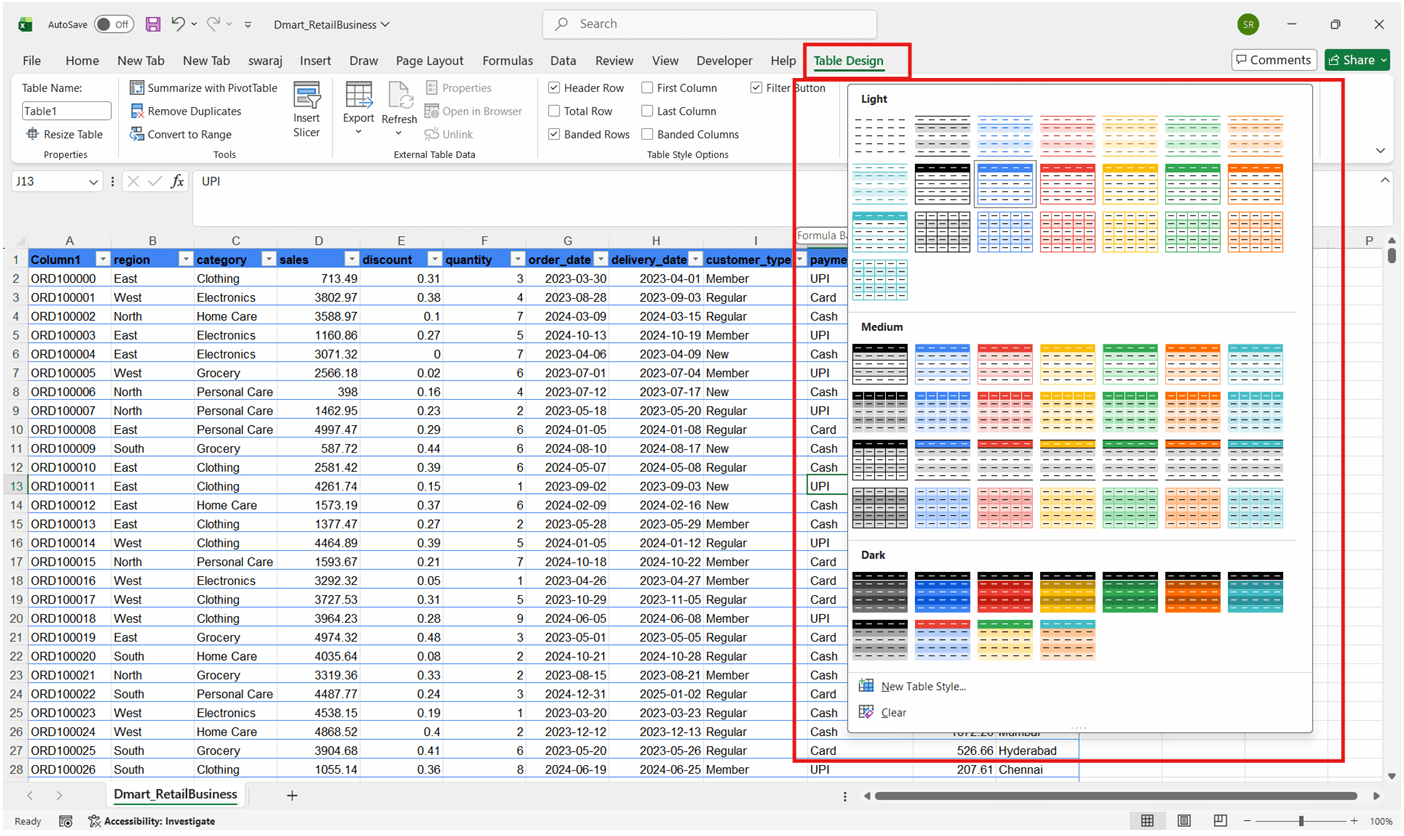
Apply a professional style from: Table Design → Table Styles
b
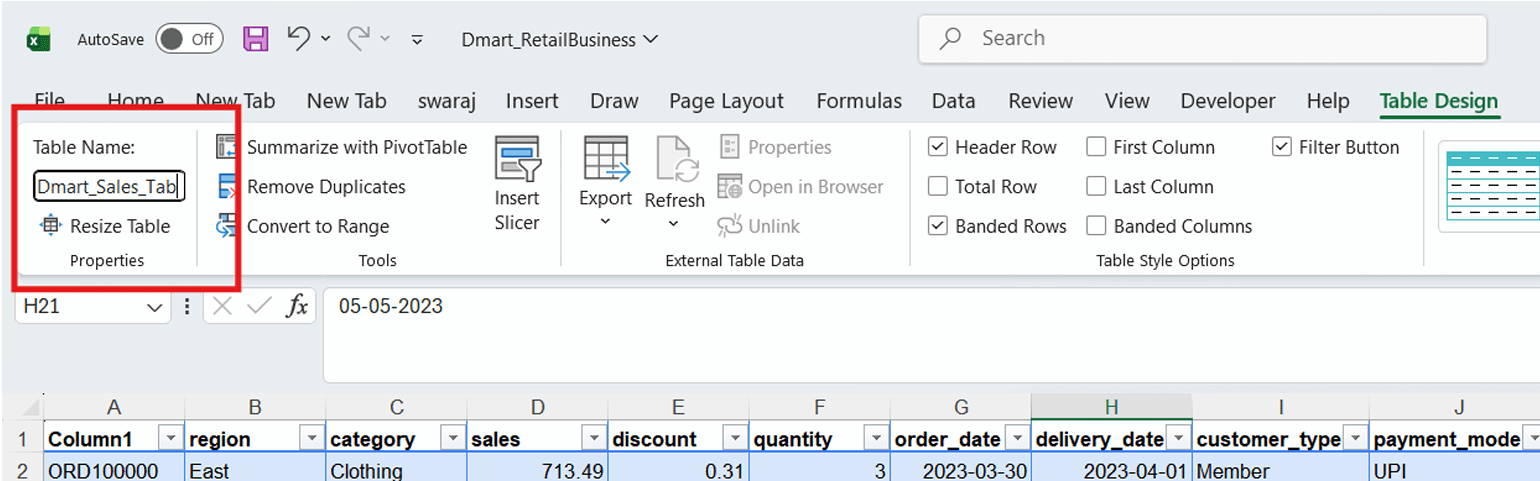
Click on any cell inside the table, go to the Table Design tab, and in the Table Name box replace the default name (such as Table1) with DMart_Sales_Table, then press Enter.
The expected outcome is that the dataset becomes easy to filter and analyze, the alternate row styling improves readability, and any new rows added later are automatically included in formulas and reports.
Task 2: Standardize, Format, and Correct Data
c
In this task, you will standardize the category, region, customer type, payment mode, city, and date-based business values into one professional and consistent format.
The goal is to ensure that the same business label does not appear in multiple styles—such as mumbai, MUMBAI, and Mumbai—because such inconsistencies can create duplicate groups and inaccurate insights in PivotTables, dashboards, and management reports.
But
What do you mean by Standardizing the Data?
Standardizing the data means converting similar values into one consistent format throughout the dataset so that the same item is not written in different ways.
For example, city like:
Should all be changed to:
This ensures the data is clean, uniform, and accurate for reporting, PivotTables, and dashboards.
Let us perform this
1
Inserting Standardized City Column
First of all we will insert a New Helper Column named as Standardized_City, where we will update the standardized values
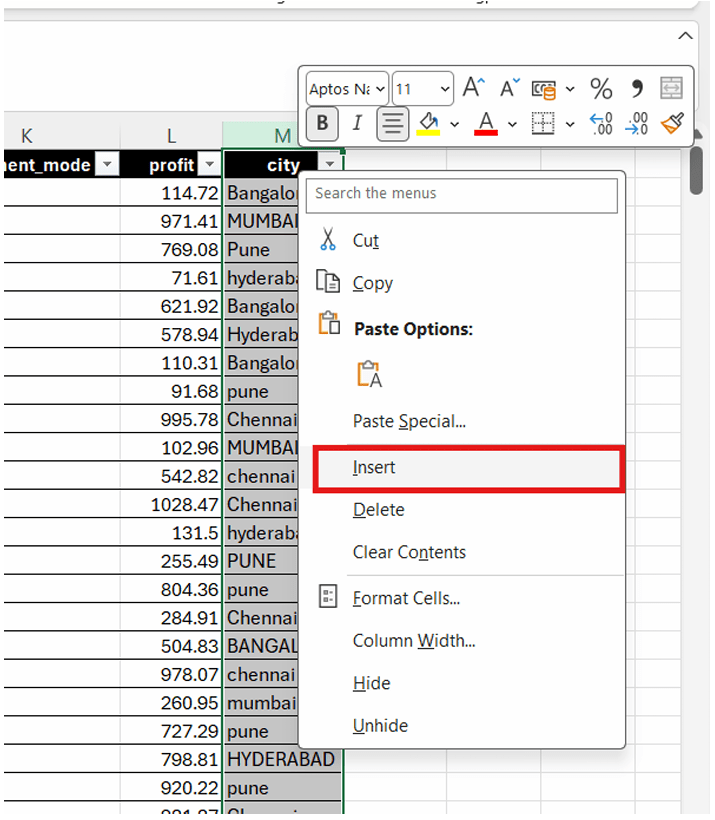
Select the column next to the city, right-click and choose Insert
a
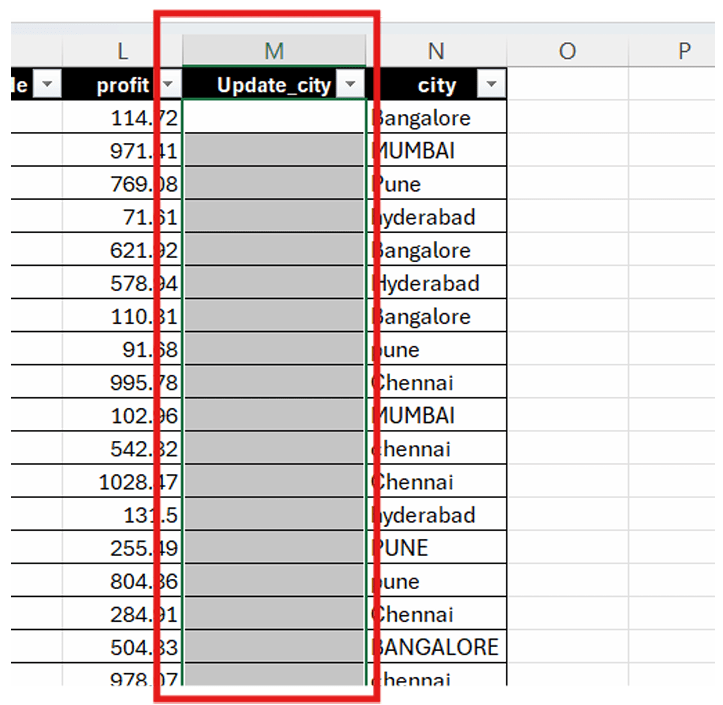
Rename the new column as Update_city.
b
2
Inserting Correct City Names
a
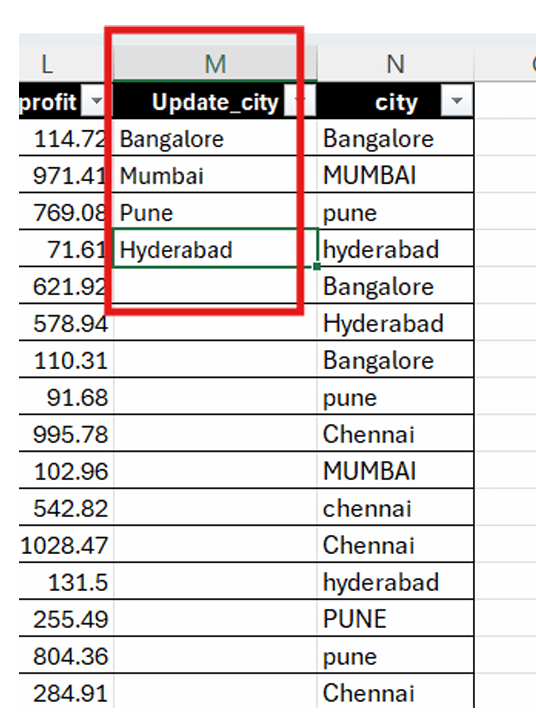
In the first row of Update_City, type the city name in the correct format.
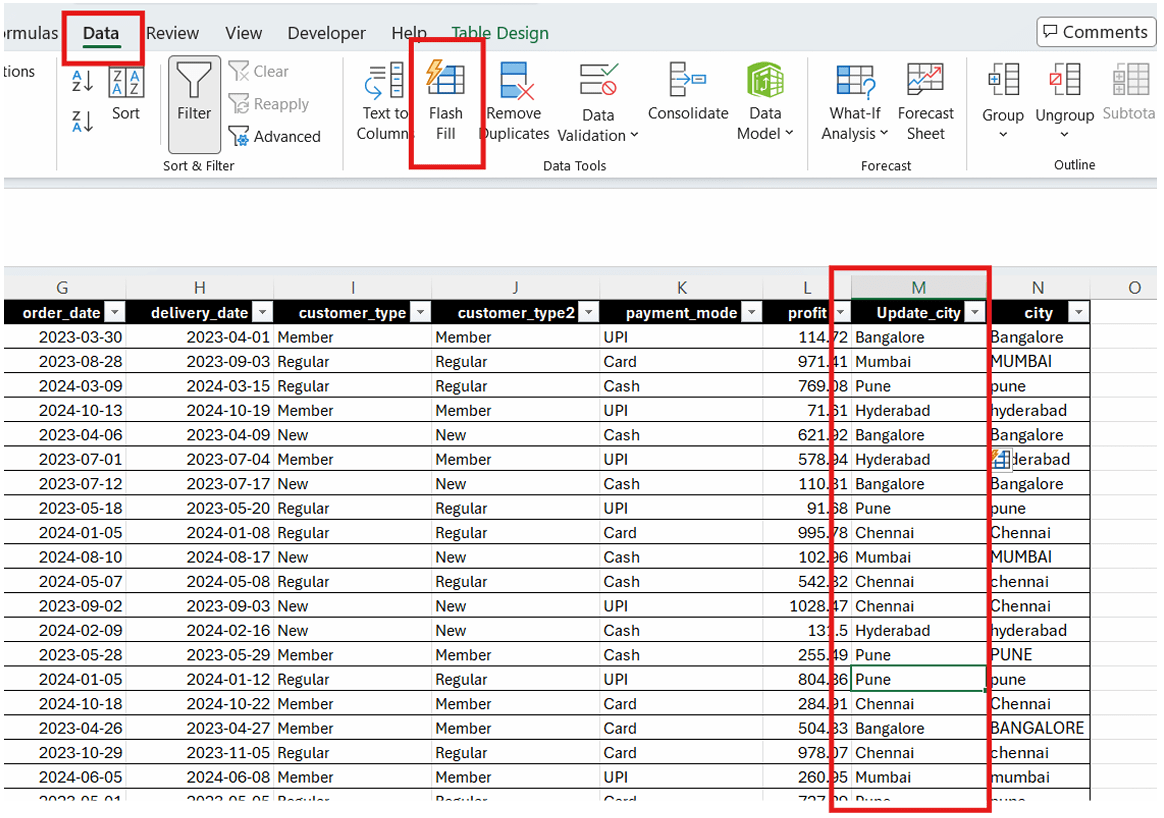
Now we will use Flashfill to fill the remaining cells.
But
What is Flash Fill in Excel? Flash Fill in Excel is a smart tool that automatically detec ts a pattern in your data and fills the remaining cells accordingly, saving time in formatting, splitting, or combining text.
Move to the second row and start typing the next 2-3 corrected city names and then press CTRL + E or you can go to the Data tab and use Flash Fill to f ill the remaining cells in the column by following the same naming pattern.
b
But here’s a twist:
Will we use the same method for other columns as well?
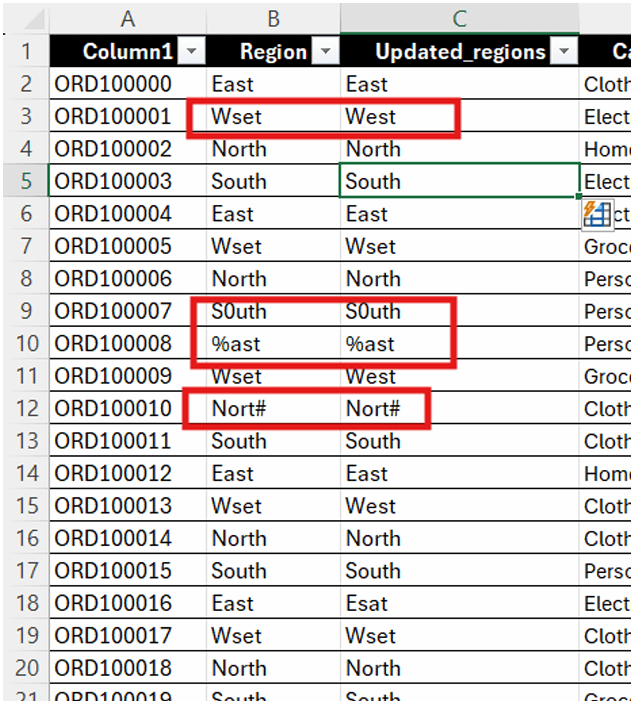
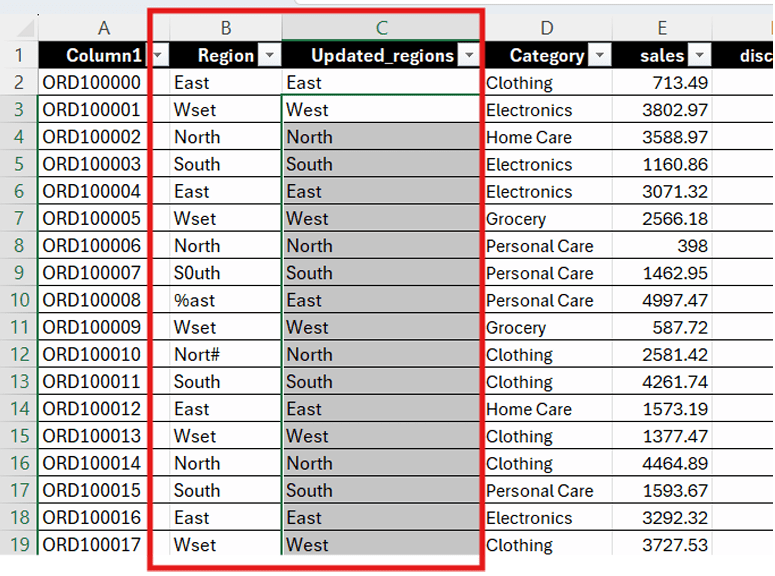
Here we can observe that rest of the columns seems to be in correct format except regions column
Let’s try fixing it using Flash Fill
Something’s wrong using the same method here
Flash Fill isn’t fixing those values because the errors (Wset, %ast, Nort#) don’t follow a consistent pattern, so Excel can’t recognize a predictable transformation.
Now what will be the right approach?
The best way to clean these columns is not Flash Fill alone, but Custom Lists + Find & Replace + Manual validation.
What is Custom Lists? Also what does manual validation mean?
A custom list is a user-defined sequence (like Jan, Feb, Mar or High, Medium, Low) that Excel can use for quick AutoFill and sorting. Manual validation means checking and correcting data entries by hand to ensure they are accurate, consistent, and error-free.
Let's see how we use this.
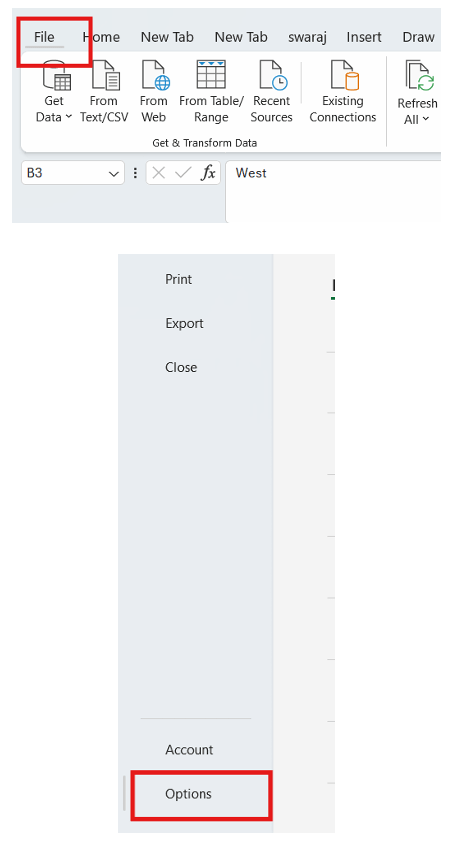
1
Go to File → Options → Advanced
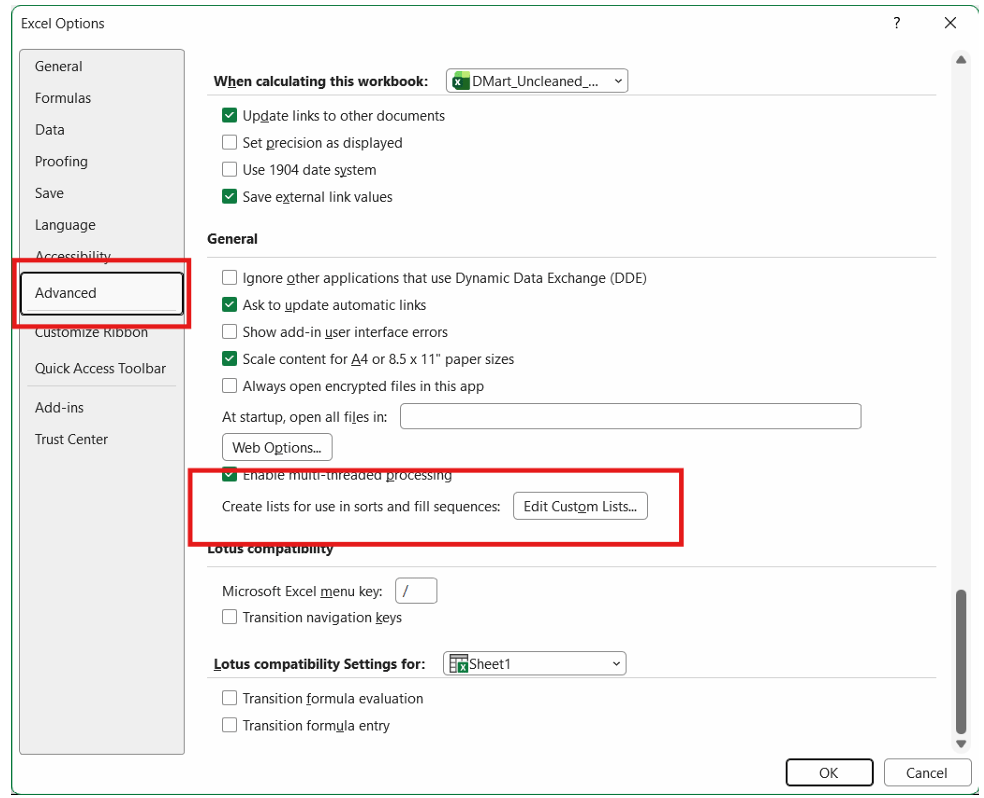
2
Edit List
a
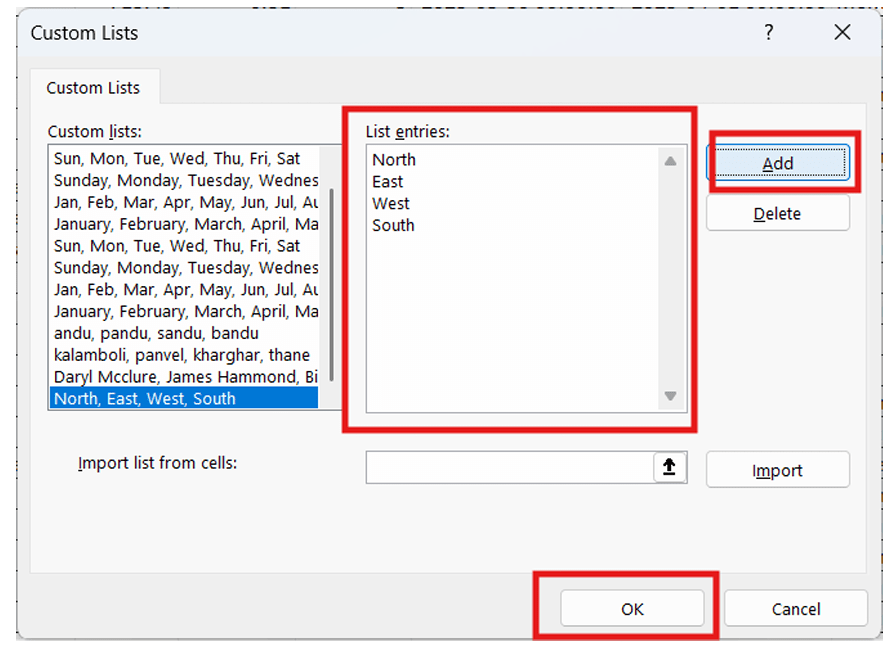
Scroll down and click on Edit Custom Lists
b
Add the regions using the correct spelling such as : North, East , West, South
This is how you create a Custom list in excel
3
Type the first correct region value and drag the fill handle
This is how you use a Custom list to fix your regions. Later you have to delete all unstandardized columns and your dataset is ready to go!
git push origin branchNameGit Push
Great job!
You have successfully completed your Cleaning and Structuring Retail Data Using Tables
In this lab, you have:
You have now completed a real-world data cleaning and preparation workflow used before building dashboards and business reports.
You are now ready to move to the next stage of development
Checkpoint
Next-Lab Preparation
Before starting the next lab, make sure you revise the following topics:
Topic : Working with a Text and Listin HTML
1) Power of HTML text tags
2) Customizing your style with CSS
3) Listing it right using HTML
4) HTML Link up , attributes of tag, block vs inline elements
Text box Width : 887
Business Scenario, Pre-lab Preparation, Next-lab Preparation, Task, Activity, Checkpoint : 90%.
Steps : 1,2,3 [Sub Steps - a,b,c]
Normal Text, Topic Name : 80%
Subtopic : 70%
Code Box font Size : 16px
By Content ITV


