AI-Assisted Investment Analysis & Pitchbook Creation

Business Scenario
You are working as a Junior Investment Analyst preparing a short investment analysis of Reliance Industries Ltd. (NSE: RELIANCE).
Your objective is to use real financial and market data, AI-assisted analysis, and presentation tools to convert raw company information into a concise investment-banking-style pitchbook.
Students will collect the required information from NSE India and Reliance Industries' official investor website, use ChatGPT to analyse the data, and finally create a six-slide pitchbook using Gamma AI.

Task 1: AI-Based Company Analysis
Download & Upload the Annual Report
1. Visit the Reliance Investor Relations page and download the Integrated Annual Report FY 2025–26 (PDF).
2. Open your AI tool (e.g., Perplexity, ChatGPT Plus).
3. Click the attachment/paperclip icon and upload the Annual Report PDF
Paste this exact prompt into the chat to extract the core operating metrics:
"Act as a financial analyst. Using ONLY the attached Reliance Industries Annual Report for FY 2025–26, answer these questions:
1
Execute AI Financial Extraction Prompt
2
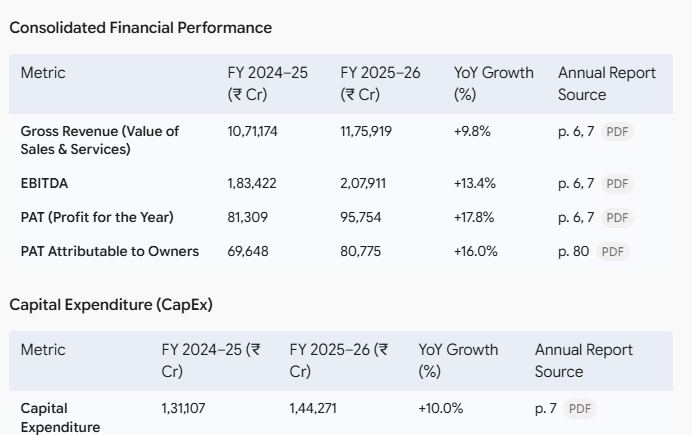
1. What was the consolidated Revenue, EBITDA, and PAT for FY 2024–25 and FY 2025–26?
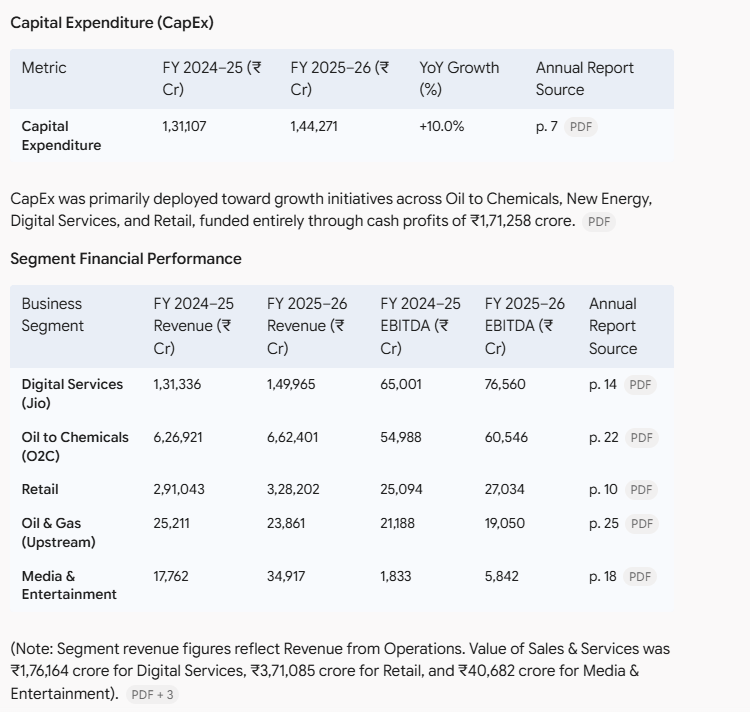
2. What was the Capital Expenditure (Capex) in both years?
3. Find the Revenue and EBITDA for these specific segments: Retail, Digital Services (Jio), Oil to Chemicals (O2C), Oil & Gas, and Media.
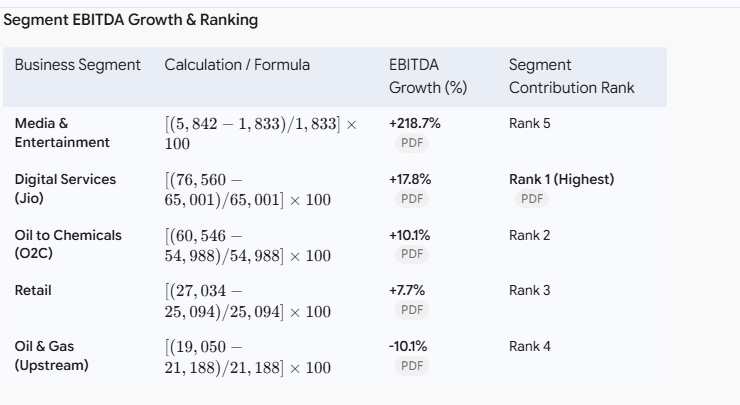
4. Calculate the EBITDA growth (%) from FY 2024–25 to FY 2025–26 for each business segment.
5. Which business segment generated the highest EBITDA?
6. Provide a brief 3-4 bullet point summary of how Reliance performed in FY 2025–26.
Important: Do not guess any figures. Mention the page number where you found each important figure. Present the data in simple, clean tables."
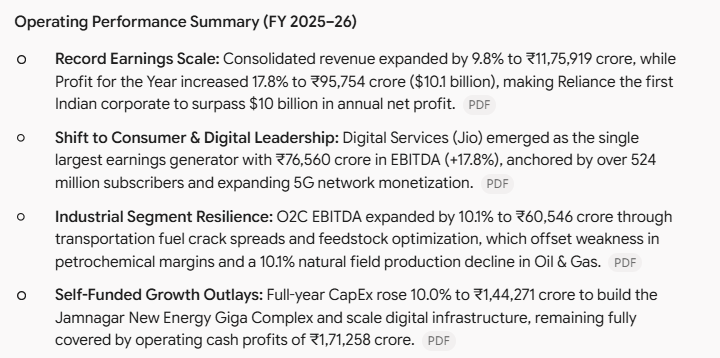
Interpret AI Output:
- Revenue increased 9.8% to ₹11.76 lakh crore.
- EBITDA increased 13.4% to ₹2.08 lakh crore.
- Profit increased 17.8% to ₹95,754 crore.
- CapEx increased 10% to ₹1.44 lakh crore, mainly for future growth.
- Jio was the strongest performer, with EBITDA growing 17.8%.
- Media & Entertainment had the highest growth at 218.7%, but from a smaller base.
- O2C and Retail also showed steady growth.
- Oil & Gas EBITDA fell 10.1%, mainly due to lower production.
Overall: Reliance had a strong FY 2025–26, with higher revenue, profits and EBITDA. Jio and consumer businesses are becoming increasingly important, while Oil & Gas remains a weaker area.
Task 2: AI-Driven Valuation Insights – Reliance Industries
Collect Live Market Data from NSE
1
1. Open a new tab and go to nseindia.com.
2. Type RELIANCE in the top search bar and select Reliance Industries Limited from the dropdown menu.
https://www.nseindia.com/get-quote/equity/RELIANCE/Reliance-Industries-Limited
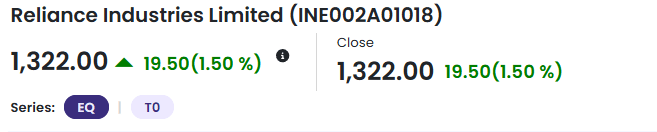
3. On the main dashboard, locate the Close Price at the top of the screen (e.g., ₹1,322.00).
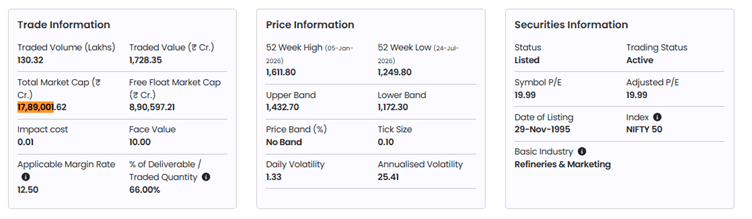
4. Scroll down to the Trade Information box on the lower left side.
5. Record the Total Market Cap (₹ Cr.) (e.g., ₹17,89,001.62).
6. Optional calculation: To find Shares Outstanding, divide the Market Cap by the Share Price (₹17,89,001.62 / ₹1,322.00 = 1,353.25 crore shares).
Execute AI Valuation Prompt
2
Paste this exact prompt into your AI tool, which has been pre-filled with the live NSE data collected from the market quote:
"Using the attached Reliance Annual Report and the live market data below, perform a valuation analysis:
- Live Share Price: ₹1,322.00
- Shares Outstanding: 1,353.25 crore (derived from a Market Cap of ₹17,89,001.82 crore)
1. Find the company's EPS, Total Gross Debt, and Cash & Cash Equivalents from the Annual Report.
2. Calculate Market Capitalization (Share Price × Shares Outstanding).
3. Calculate Net Debt (Gross Debt – Cash & Cash Equivalents).
4. Calculate Enterprise Value (Market Capitalization + Net Debt).
5. Calculate the EV/EBITDA multiple using the FY 2025–26 EBITDA you found earlier.
6. Based on the Management Discussion & Analysis (MD&A), identify the 3 main strengths and 2 main risks for Reliance.
7. Based on this valuation and risk profile, is Reliance financially strong, average, or weak? Keep the explanation simple and format the math steps in a clear table."
AI Output:
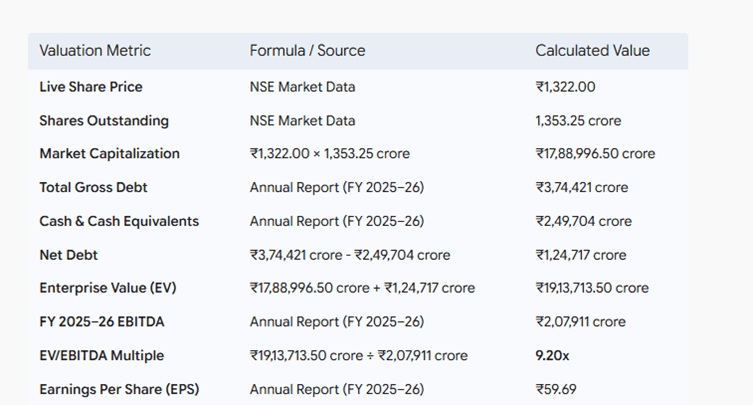
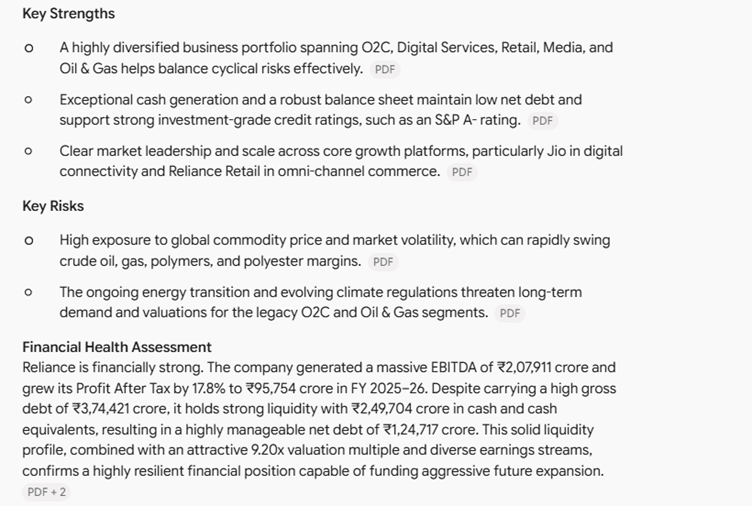
Intrepret AI Output:
Reliance Industries FY 2025–26
-
Market Cap: ₹17.89 lakh crore
-
Net Debt: ₹1.25 lakh crore
-
Enterprise Value: ₹19.14 lakh crore
-
EBITDA: ₹2.08 lakh crore
-
EV/EBITDA: 9.20×
-
EPS: ₹59.69
Reliance is financially strong and diversified, supported by high EBITDA, strong cash reserves, and multiple businesses such as Jio and Retail. Key risks are commodity price volatility and the long-term energy transition.
The company appears financially resilient with good capacity for future growth and investment.
Task 3: Generate Pitchbook using Gamma AI
Set Up Gamma AI
1
-
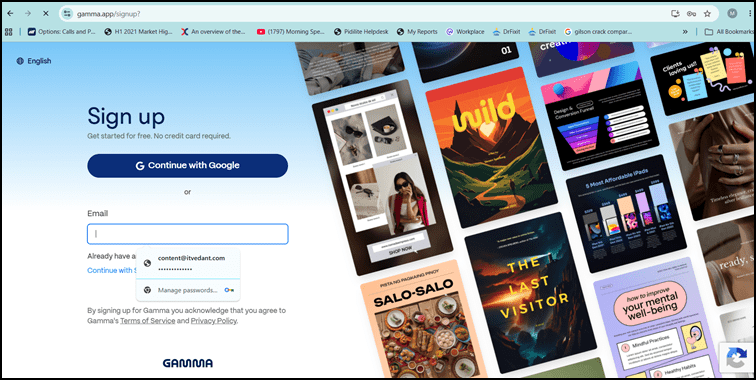
Open your web browser and navigate to gamma.app.
https://gamma.app/
-
Log in or sign up for a free account.
-
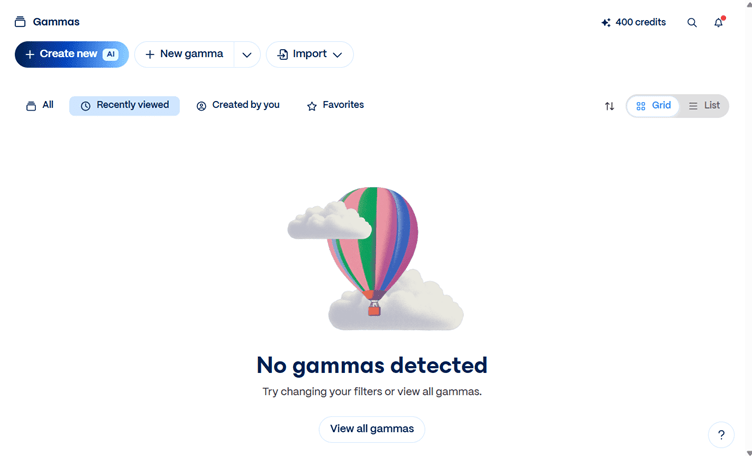
On the main dashboard, click the Create new with AI button.
-
Select the Paste in text (or Generate) option, as you will provide a detailed prompt.
-
Choose Presentation as your desired output format and set the slide count to 10 cards/slides.
Enter the Generation Prompt
2
Paste the exact text below into the Gamma input box.
Create a complete 10-slide professional pitchbook for Reliance Industries Limited based on the uploaded Annual Report. IMPORTANT: I need the final presentation as a downloadable Microsoft PowerPoint (.PPTX) file, not just text or a Gamma webpage.
Create 10 fully designed presentation slides. Use professional financial charts, graphs, icons, diagrams, tables and relevant business graphics. Use the actual figures from the uploaded Reliance Annual Report. Keep the language simple and suitable for beginner finance students. Use a clean investment-banking / corporate pitchbook style.
Include:
1. Company Overview
2. Business Segments
3. Financial Performance
4. Revenue & Profit Growth
5. Key Strengths
6. Key Risks
7. Future Growth Opportunities
8. Valuation Snapshot
9. Investment View
10. Conclusion & Sources
Make charts and graphics visually attractive and easy to understand. Do not provide only slide text. Generate the actual presentation. Export/download the completed presentation as a .PPTX PowerPoint file. Make sure the PPTX contains the graphics, charts, tables and formatting, not just plain text. Final output required: ONE downloadable .PPTX PowerPoint presentation.
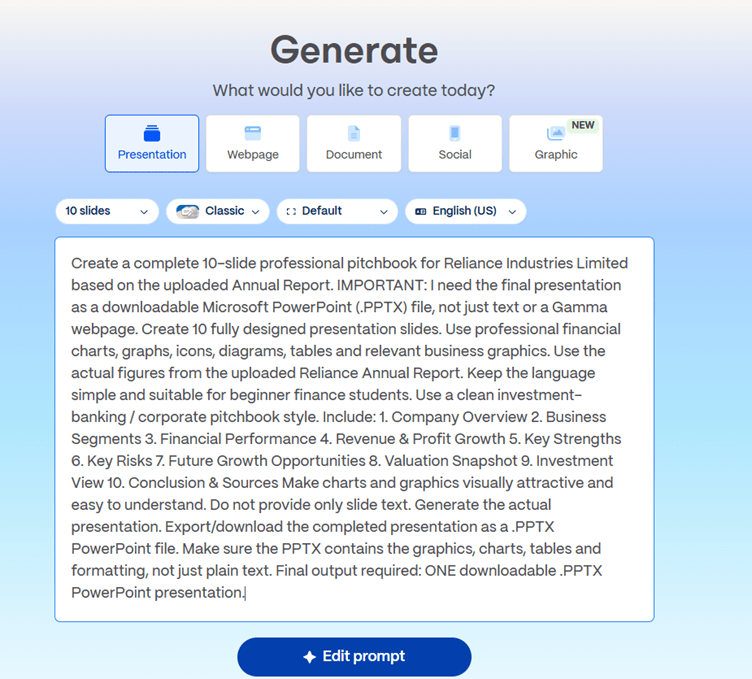
Generate the Presentation
3
-
Click Edit Prompt and Review your prompt.
-
Click Continue and select a professional, corporate visual theme (e.g., navy blue, minimalist, or finance-oriented).
-
Click Generate and wait 30-60 seconds for the AI to design and format all 10 slides
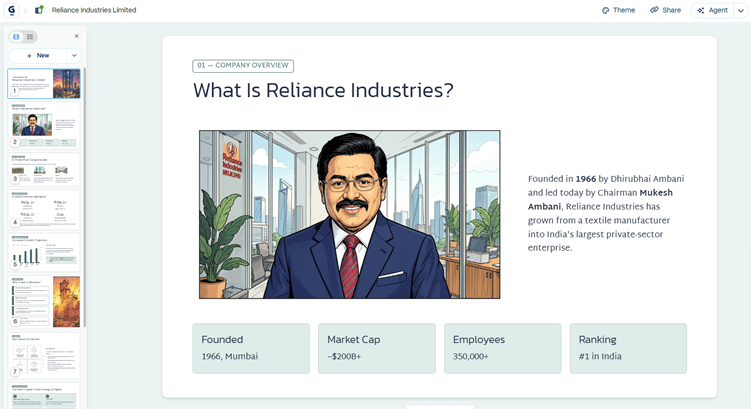
-
Your Pitchbook is ready.
Export to Microsoft PowerPoint (.PPTX)
4
-
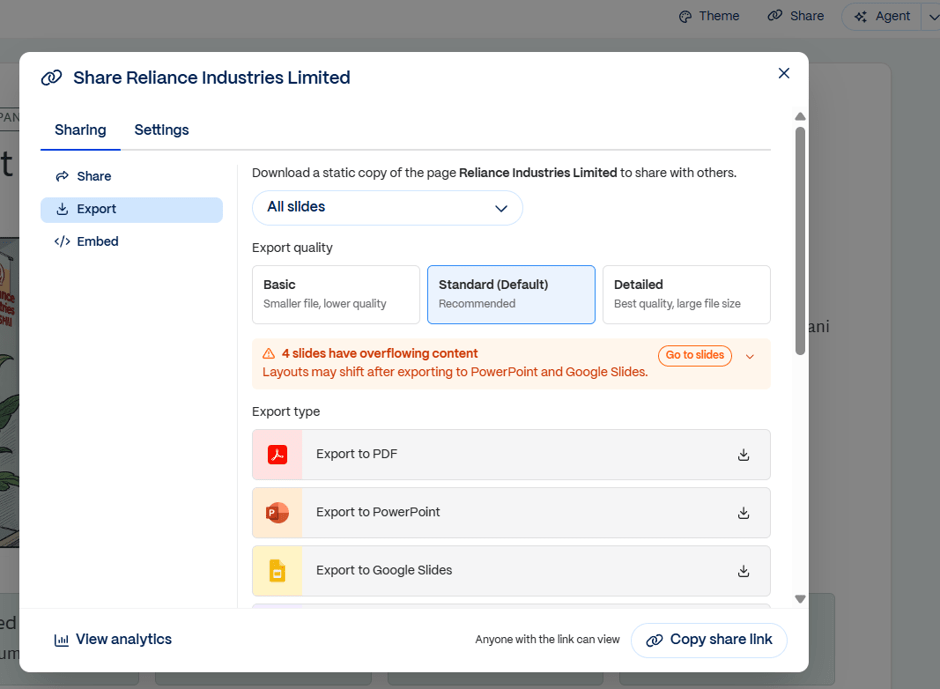
Once generation is complete, click the Share button located in the top-right corner of the Gamma interface.
-
Select Export from the dropdown menu.
-
Choose Export to PowerPoint.
-
The file will process and automatically download to your device as an editable .PPTX file containing all text, tables, and graphics.