Clean and Prepare Dataset for Analysis

Business Scenario

Welcome!
Today is your sixth day as a Junior Data Analyst at a retail analytics company.
In real-world business environments, datasets often contain missing values, inconsistent data types, and duplicate records. Before performing analysis, data analysts must clean and prepare the data to ensure accurate and reliable results.
Data cleaning improves data quality, reduces errors, and helps organizations make better business decisions based on trustworthy information.
Pre-Lab Preparation
Click here to download previous lab file: DM LAB 5
git pull origin branchName
Git Pull
Click to download Dataset : Retail_Dataset
Topic: Data Manipulation with Pandas
1) Polishing Data: From Messy To Meaningful
Task 1: Fix data types
Retail datasets are collected from multiple sources such as billing systems, inventory software, supplier databases, and online stores. Sometimes numerical fields like Revenue, Unit Price, or Quantity Available may be stored as text instead of numbers.
When data types are incorrect:
- Revenue calculations may fail.
- Sales reports become inaccurate.
- Statistical analysis cannot be performed.
- Business dashboards may display incorrect results.

To ensure accurate analysis, data analysts must identify and correct data types before performing calculations.
What are Data Types?
Data types define the kind of values stored in each column. Common data types include integers, floating-point numbers, strings, and dates.
Open Google Colab
1
2
Import Required Libraries
import pandas as pd
import numpy as np
3
Upload the Retail Dataset
4
Load Dataset Using Pandas
df = pd.read_csv("/content/Retail_Dataset_Modified.csv")

print("Dataset Loaded Successfully")
Display First Five Records
5
df.head()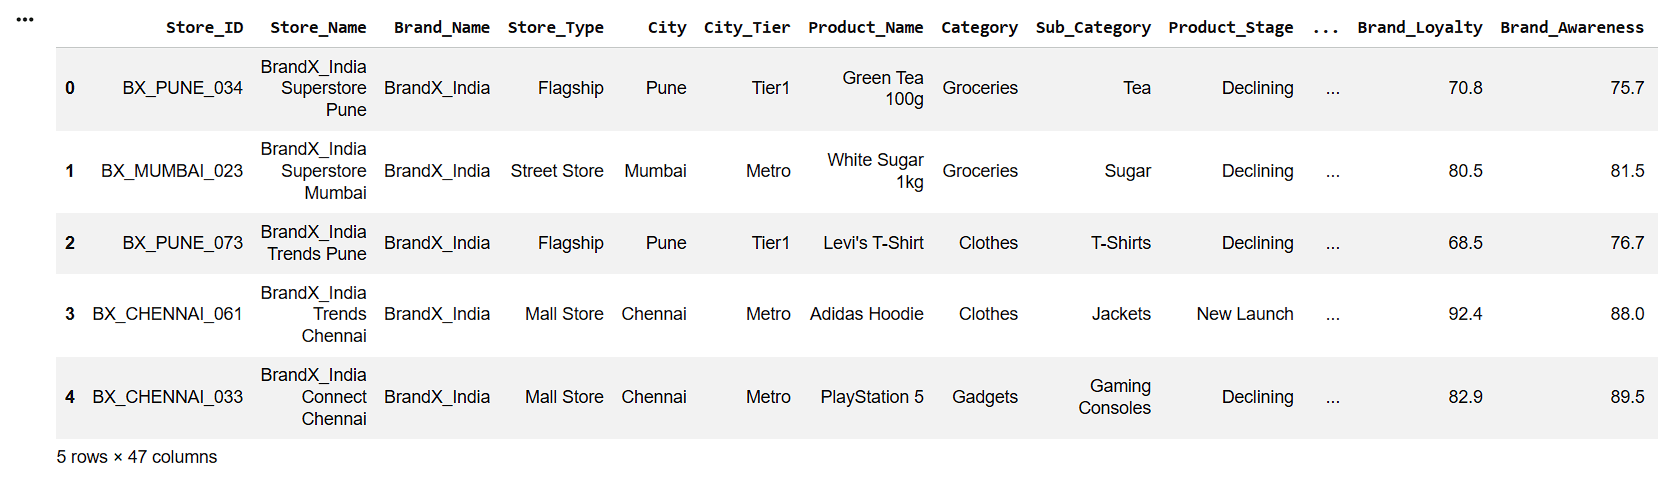
6
Display Data Types
print("Data Types:")
print(df.dtypes)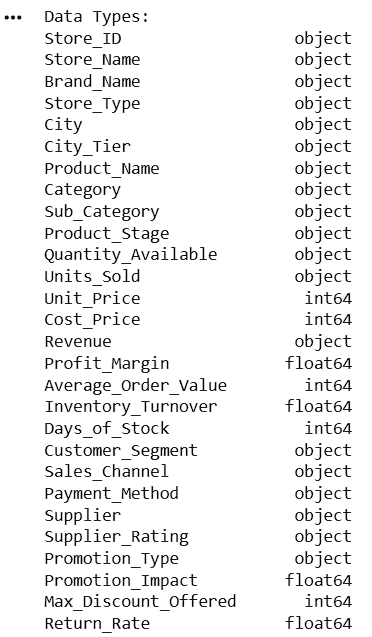
7
Check Dataset Information
df.info()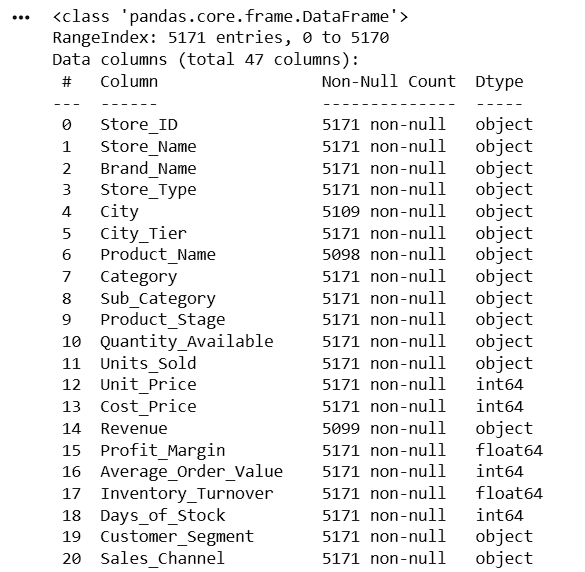
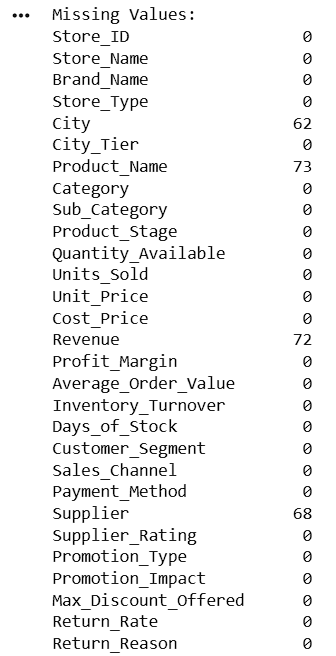
After examining the dataset using df.dtypes, the following columns were found to have incorrect data types:
| Column Name | Current Data Type | Expected Data Type |
|---|---|---|
| Quantity_Available | object | int64 |
| Units_Sold | object | int64 |
8
Convert Quantity_Available to Numeric
| Column Name | Current Data Type | Expected Data Type |
|---|---|---|
| Revenue | object | float64 |
| Shipping_Cost | object | float64 |
df['Quantity_Available'] = pd.to_numeric(
    df['Quantity_Available'],
    errors='coerce'
)
Here,
pd.to_numeric()
- Converts the selected column into a numeric data type.
errors='coerce'
- If Pandas finds any invalid value (such as text, symbols, or blank spaces), it converts that value into NaN (Not a Number) instead of showing an error.
df['Quantity_Available'] = df['Quantity_Available'].astype('Int64')print(df['Quantity_Available'].dtypes)
9
8
Convert Units_Sold to Numeric
df['Units_Sold'] = pd.to_numeric(
    df['Units_Sold'],
    errors='coerce'
)

df['Units_Sold'] = df['Units_Sold'].astype('Int64')

print(df['Units_Sold'].dtypes)
10
11
12
13
Display Unique Values from Product Category
print(df['Category'].unique())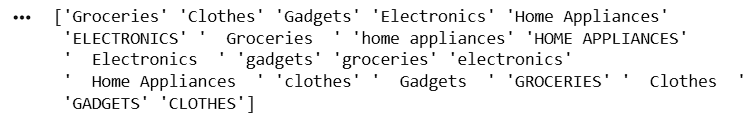
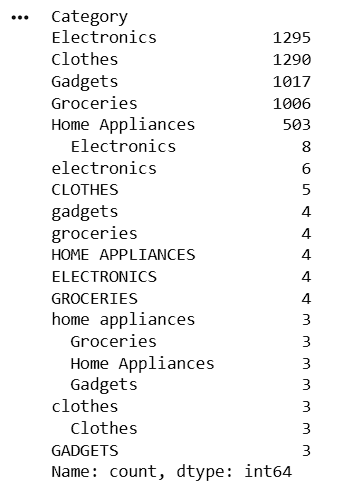
Count Occurrences of Each Product Category
print(df['Category'].value_counts())14
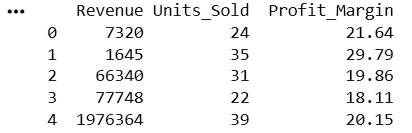
Select Specific Columns
selected_columns = df[['Revenue',
                        'Units_Sold',
                        'Profit_Margin']]

print(selected_columns.head())
15
16
Access a Specific Row
print(df.iloc[0])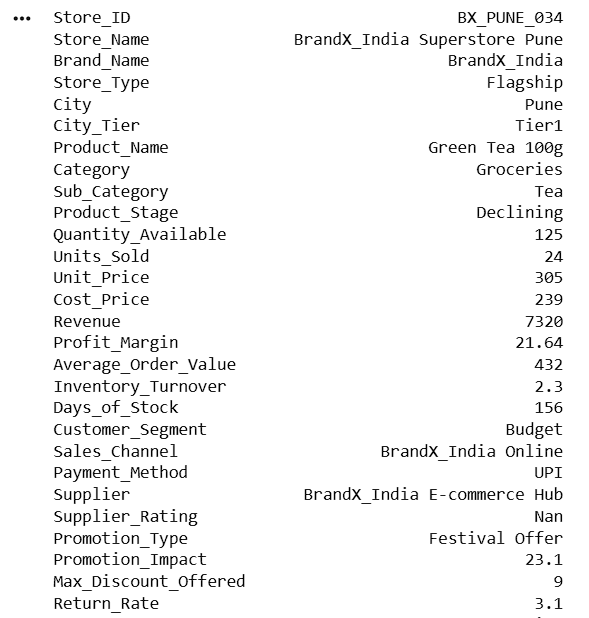
17
Display Dataset Shape
print("Dataset Shape:")
print(df.shape)
Task 2: Filter Data
Retail analysts frequently filter data to identify specific business conditions such as high revenue transactions, low inventory products, or top-performing categories.
What is Filtering?
Filtering is the process of selecting rows that satisfy specific conditions.
1
Filter Products with Unit Price Greater Than 1000

high_price = df[df['Unit_Price'] > 1000]
high_price[['Product_Name', 'Category', 'Unit_Price']].head()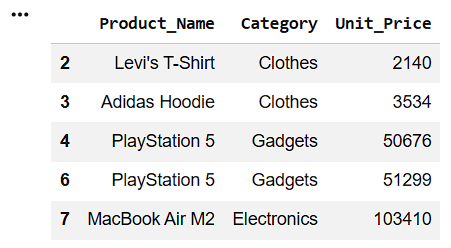
Filter Products with Unit Price Less Than 500
2
low_price = df[df['Unit_Price'] < 500]
low_price[['Product_Name', 'Category', 'Unit_Price']].head()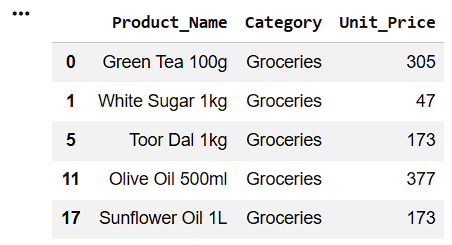
3
Filter Products with Unit Price Between 500 and 1500
medium_price = df[
    (df['Unit_Price'] >= 500) &
    (df['Unit_Price'] <= 1500)
]
medium_price[['Product_Name', 'Category', 'Unit_Price']].head()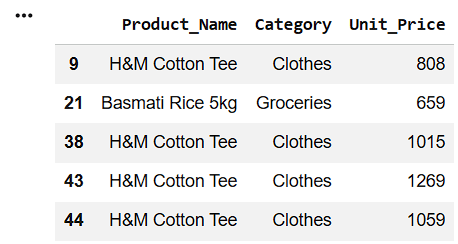
4
Sort Data by Unit Price (Highest to Lowest)
sorted_price = df.sort_values(
    by='Unit_Price',
    ascending=False
)
sorted_price[['Product_Name', 'Category', 'Unit_Price']].head()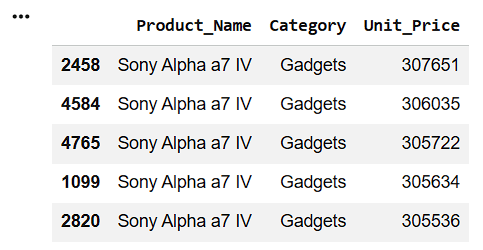
5
Display Top 10 Highest Unit Price Products
top_price = df.nlargest(10, 'Unit_Price')
print(top_price[['Unit_Price']])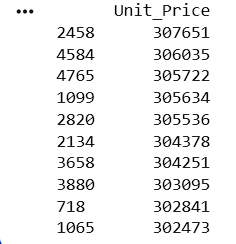
6
Count Records with Unit Price Greater Than 1000
print("Number of Products with Unit Price > 1000:")
print(len(high_price))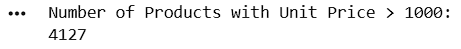
Great job!
You have successfully completed your lab on Navigate and Filter Data Using Pandas DataFrames.In this lab, you have: Loaded data into Pandas DataFrames, Explored rows and columns, Accessed specific records, Filtered data using conditions, Applied multiple filtering criteria, Sorted and analyzed business data
You are now ready to move to the next stage of Junior Data Analyst.
Checkpoint
Git Push
git push origin branchNameNext-Lab Preparation
Topic: Data Manipulation with Pandas
1) Polishing Data: From Messy To Meaningful