Evaluate Regression Model Performance

Business Scenario
Welcome back!
Today is your fifth day as a Junior Data Scientist at AutoVision Analytics.
In Day 4, you successfully prepared the dataset, selected the relevant features, split the data into training and testing sets, and built your first Vehicle Price Prediction Model using a regression algorithm. The model has now been trained and is generating predictions for vehicle prices. However, building a model is only the first step—before it can be deployed, the management team wants to know how accurately and reliably it performs on unseen data.

They need clear evidence that the predictions are trustworthy for business decisions. As a Junior Data Scientist, you have been assigned the responsibility of evaluating the model using regression metrics such as MAE, MSE, RMSE, and R² Score, interpreting the results, and presenting your findings to the analytics team.
Pre-Lab Preparation
Topic : Supervised Learning – Regression
1) Model Evaluation Metrics (R²-score, MSE, MAE, RMSE)
git pull origin branchName
Git Pull
Task 1: Review Model Predictions
Before evaluating a machine learning model using performance metrics, Data Scientists first compare the actual values with the predicted values. This initial review helps them understand how closely the model's predictions match the true values and identify any obvious errors or patterns.
Click to download previous file : ML Lab 4.ipynb
1
Review the Actual Values and Predicted Values, compare both, and record your observations based on how closely the predictions match the actual prices.
comparison = pd.DataFrame({ "Actual": Y_test, "Predicted": y_pred })
comparison.head(10)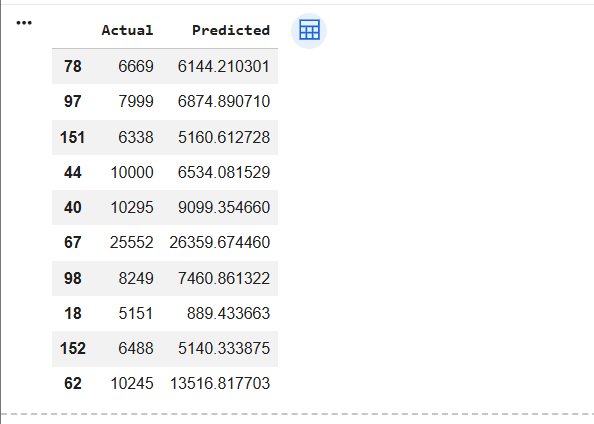
Activity
Prepare a Prediction Review Report.
| Actual Price | Predicted Price | Observation |
|---|---|---|
Task 2: Calculate Mean Absolute Error (MAE)
The management team wants to know the average prediction error made by the model.

Mean Absolute Error (MAE)
MAE calculates the average absolute difference between actual and predicted values.
- Lower MAE indicates better model performance.
- MAE is measured in the same unit as the target variable.
Import the required library
1
from sklearn.metrics import mean_absolute_errorCalculate MAE
2
mae = mean_absolute_error(Y_test, y_pred)
print("Mean Absolute Error:", mae)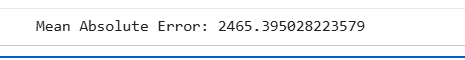
Task 3: Calculate Mean Squared Error (MSE)
The management team also wants a metric that penalizes larger prediction errors more heavily.
Mean Squared Error (MSE)
MSE calculates the average squared difference between actual and predicted values.
- Lower MSE indicates better model performance.
- Larger errors receive greater penalties.
Import the required library
1
from sklearn.metrics import mean_squared_errorCalculate MAE
2
mse = mean_squared_error(Y_test, y_pred)
print("Mean Squared Error:", mse)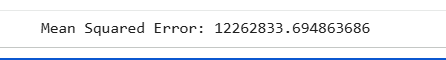
Task 4: Evaluate R² Score
Finally, the management team wants to know how well the model explains the variation in vehicle prices.
R² Score (Coefficient of Determination)
R² Score measures how well the model explains the variability of the target variable.
- R² = 1 → Perfect prediction
- R² = 0 → Model performs no better than predicting the average
- Higher R² indicates better model performance
Import the required library
1
from sklearn.metrics import r2_scoreCalculate the R² Score
2
r2 = r2_score(Y_test, y_pred)
print("R² Score:", r2)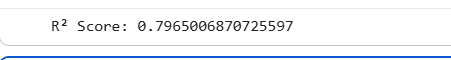
Task 5: Business Decision
The management team now wants your recommendation.
Based on the calculated metrics:
- Is the model performing well?
- Which metric indicates good performance?
- Can the model be improved further?
- Should the model be deployed or optimized further?
Great job!
You have successfully completed the 5th lab: Evaluate Regression Model Performance.
In this lab, you reviewed model predictions, calculated Mean Absolute Error (MAE), Mean Squared Error (MSE), and evaluated the R² Score to measure the performance of your Linear Regression model. You interpreted these metrics and prepared a performance summary for the management team.
Your model has now been successfully evaluated and is ready for further improvement and comparison with other Machine Learning models.
You are now ready to move to the next stage of the Automobile Intelligence Project.
Checkpoint
Git Push
git push origin branchNameNext-Lab Preparation
Topic : Supervised Learning – Regression
1) Regularisation ,Lasso & Ridge