


Content ITV PRO
This is Itvedant Content department
Learning Outcome
5
Build a forecasting workflow
4
Interpret ACF & PACF plots
3
Test stationarity
2
Identify p, d, q parameters
1
Understand ARIMA components
Quick Recall
Neural Networks
Loss Functions
Optimization Techniques
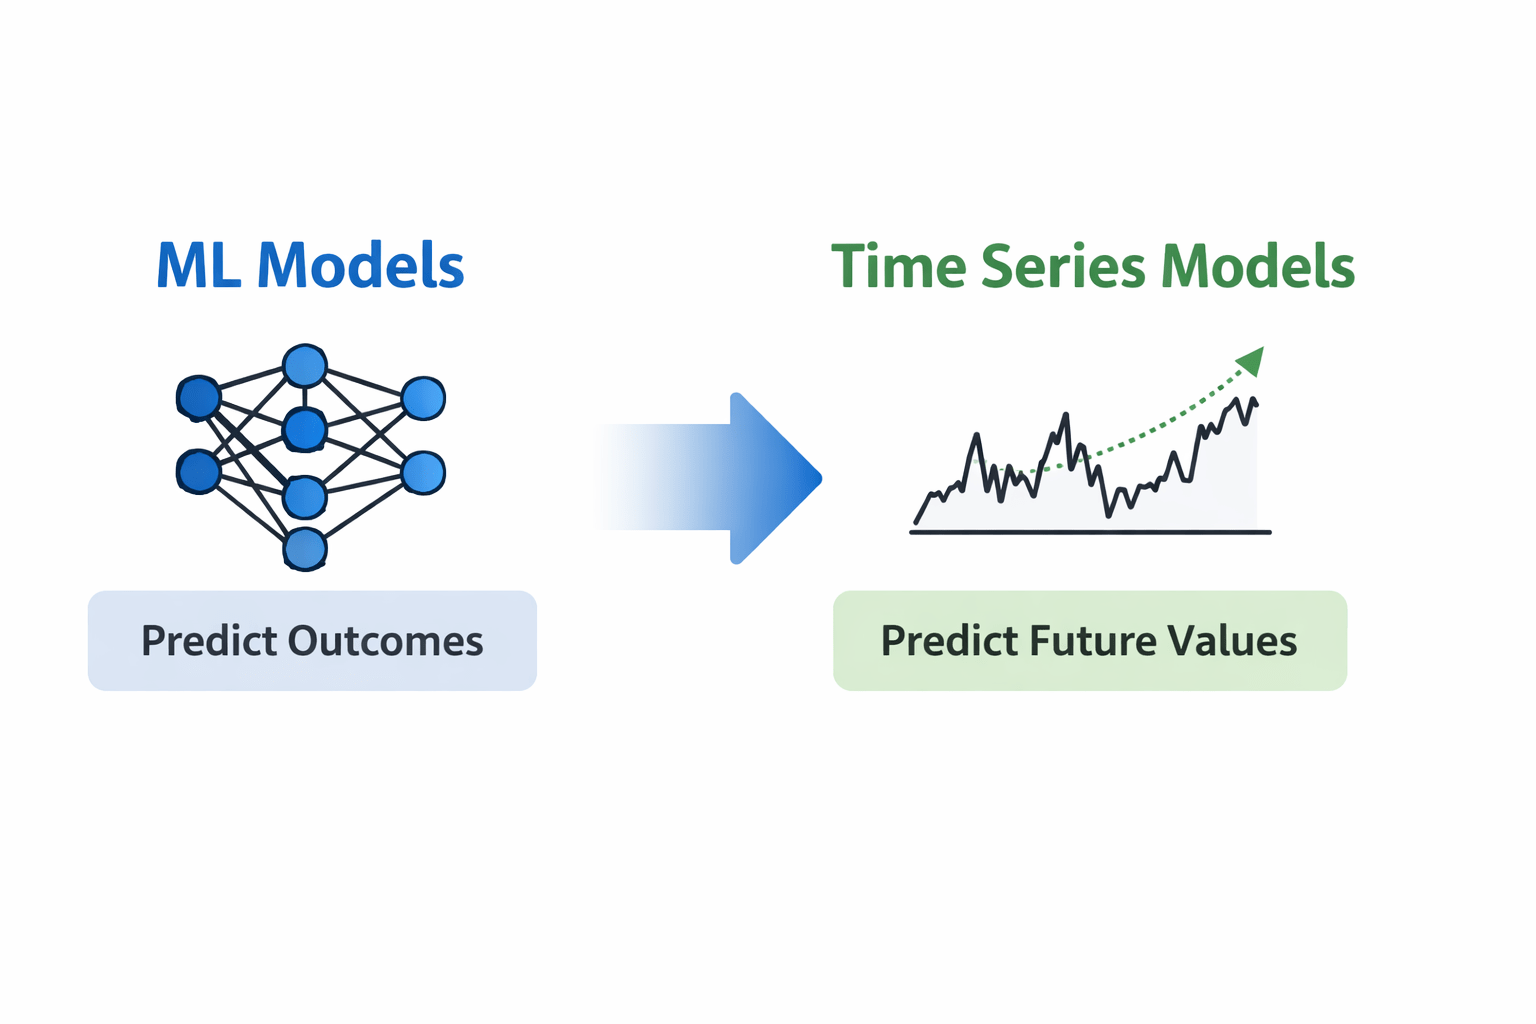
Those models learn relationships in features
Today we learn models for sequential data
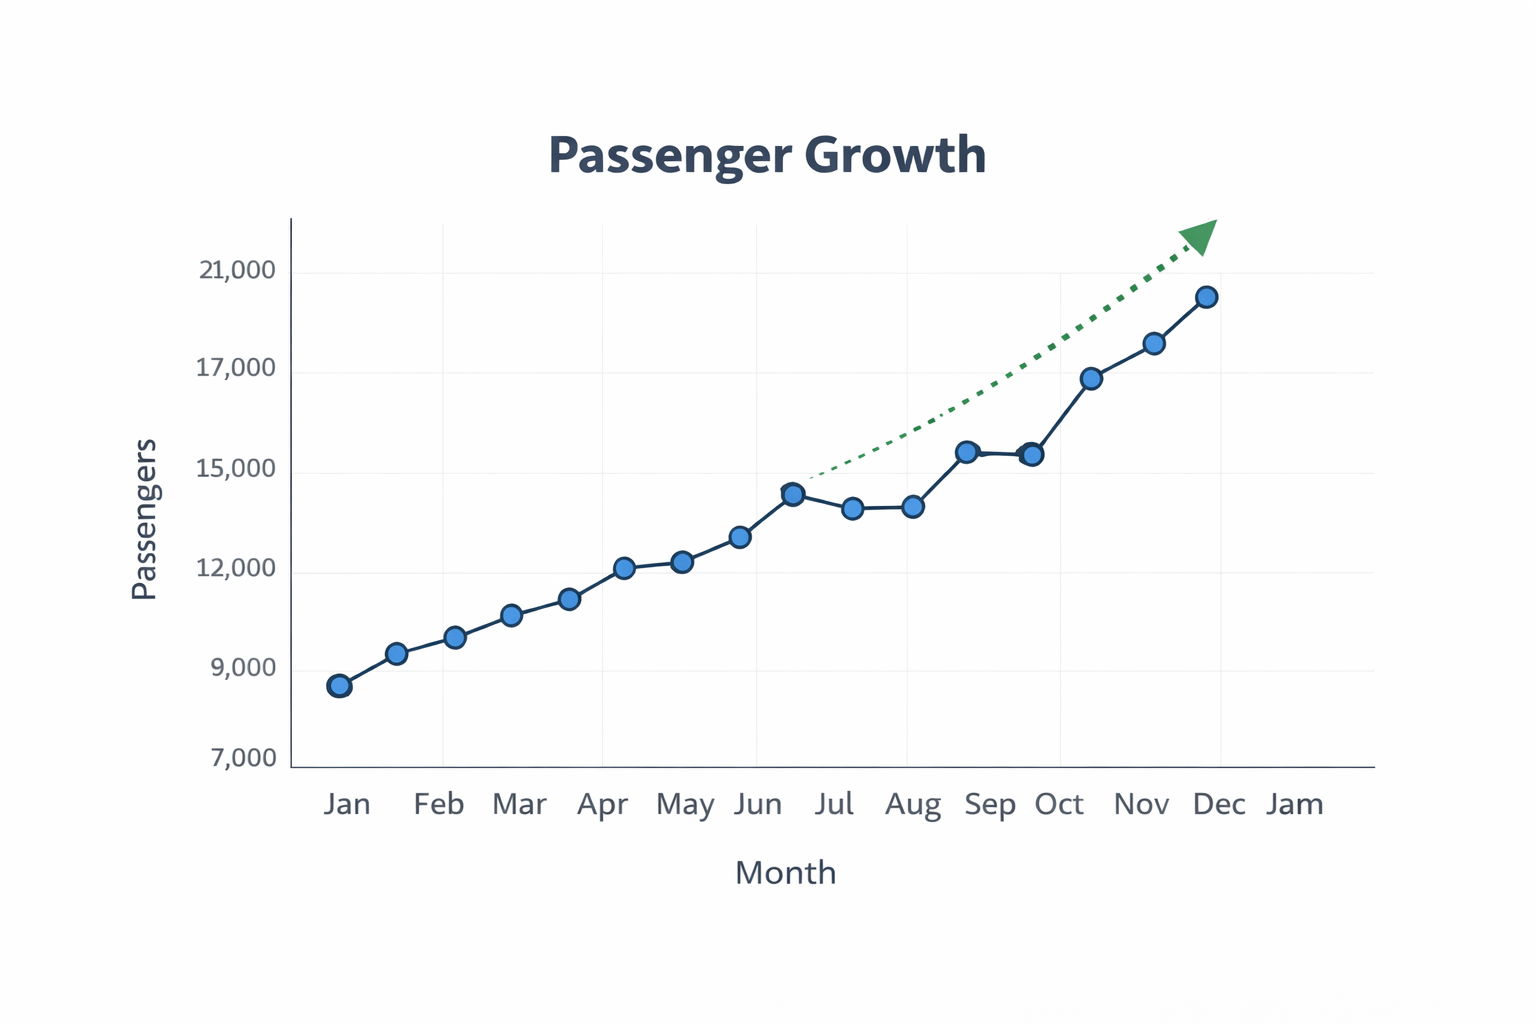
An airline wants to forecast how many passengers will travel next month.
Challenges:
Changing trends
Seasonal variations
Random fluctuations
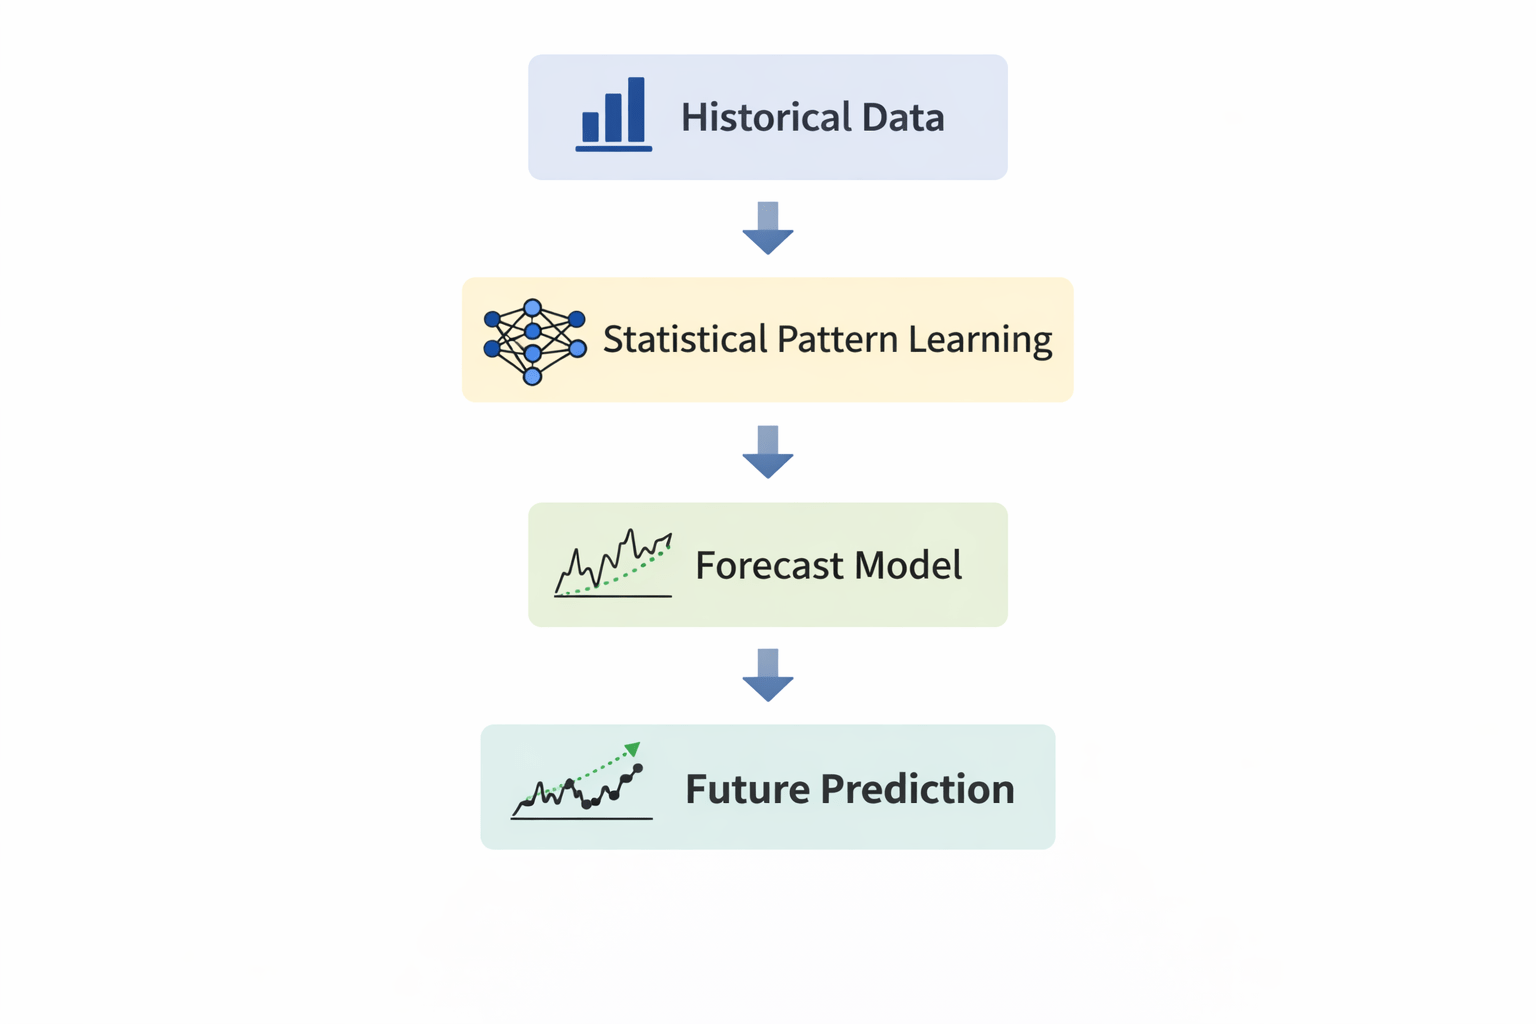
How Machines Solve This:
They analyze patterns from past data:
Previous passenger values
Trend changes over time
Error patterns
Solution:
Use the ARIMA Model for forecasting
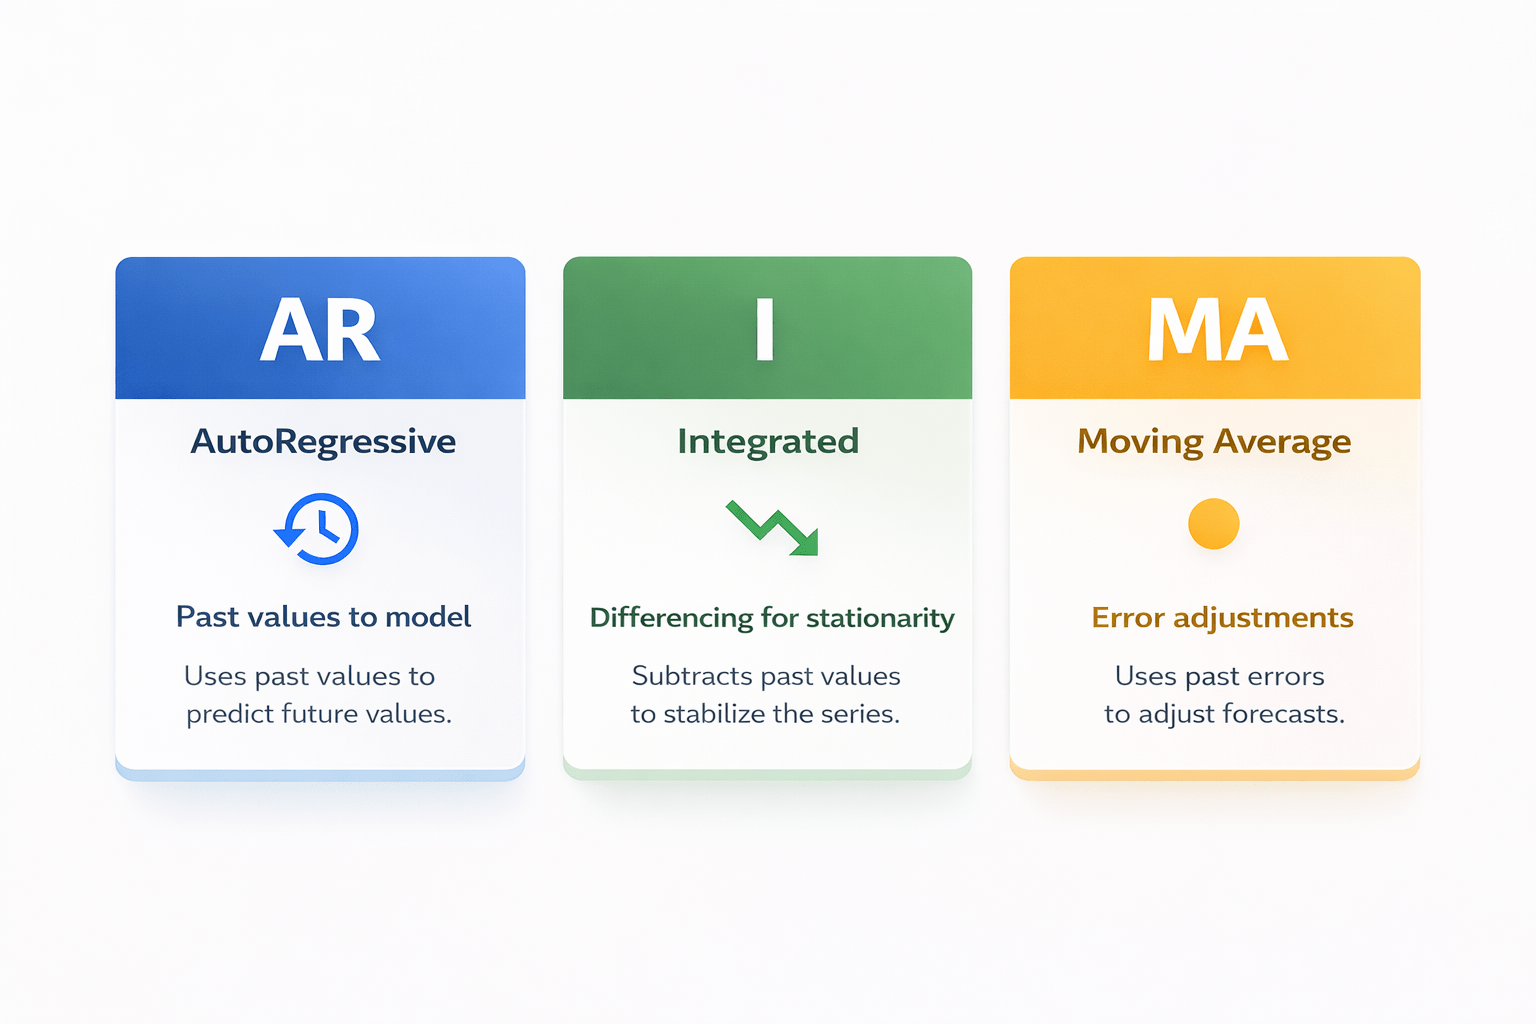
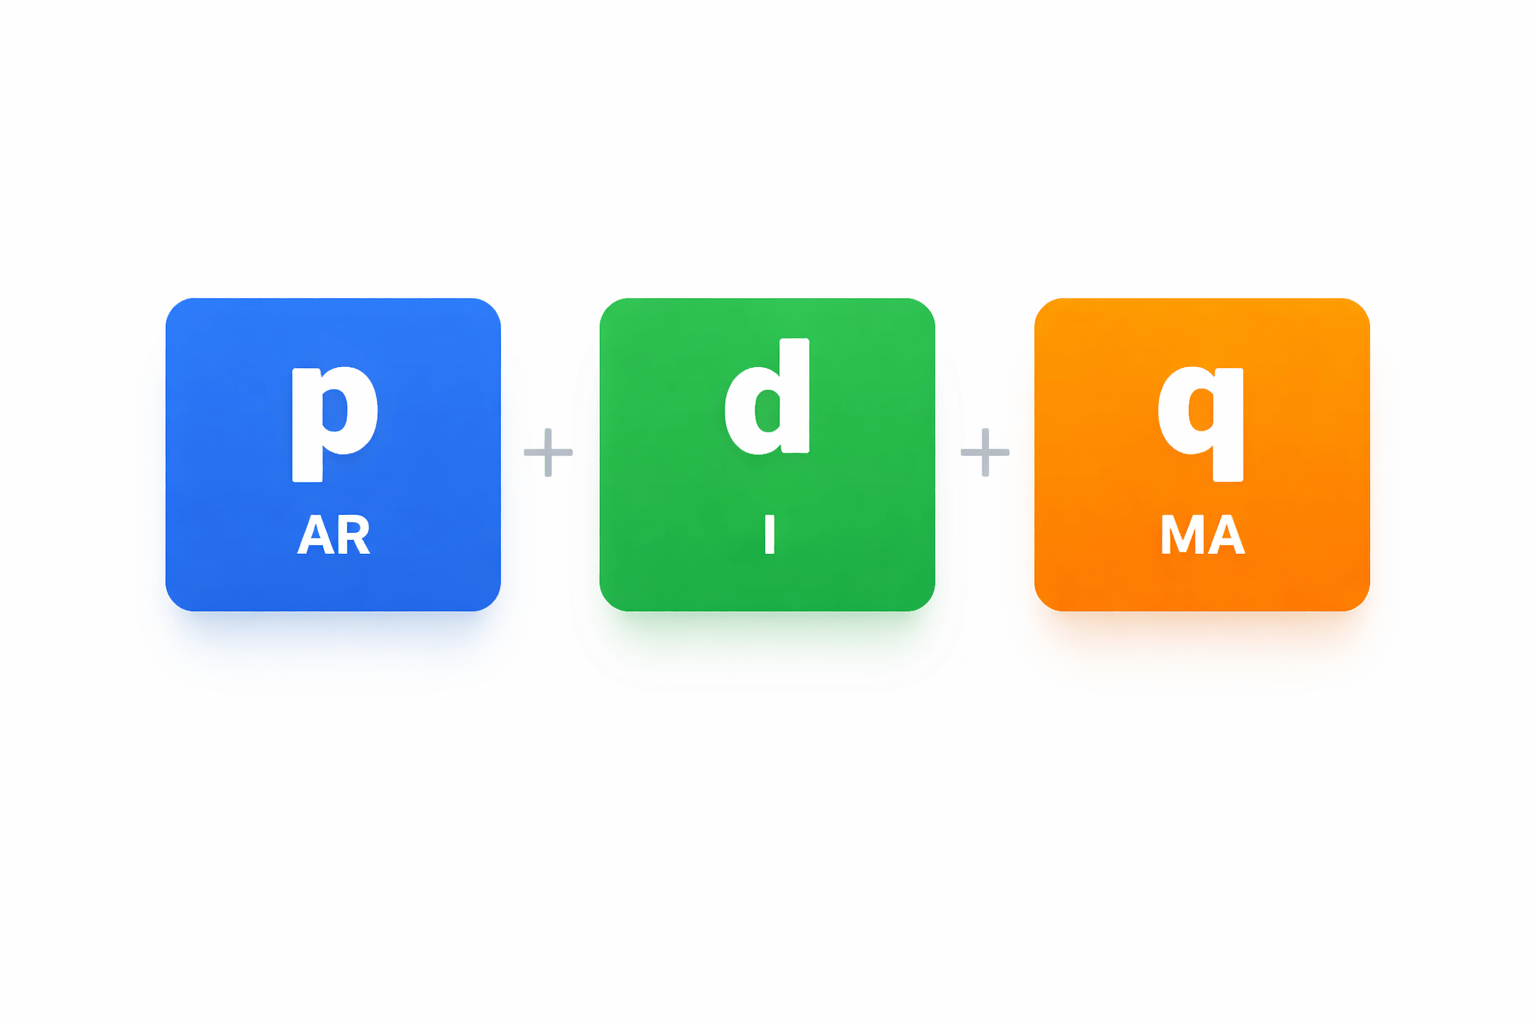
What is ARIMA?
AutoRegressive Integrated Moving Average
Model format
ARIMA(p, d, q)
Components Overview
p
AR order
Controls past value influence
Controls trend removal
Controls error adjustment
d (Differencing)
q (MA order)
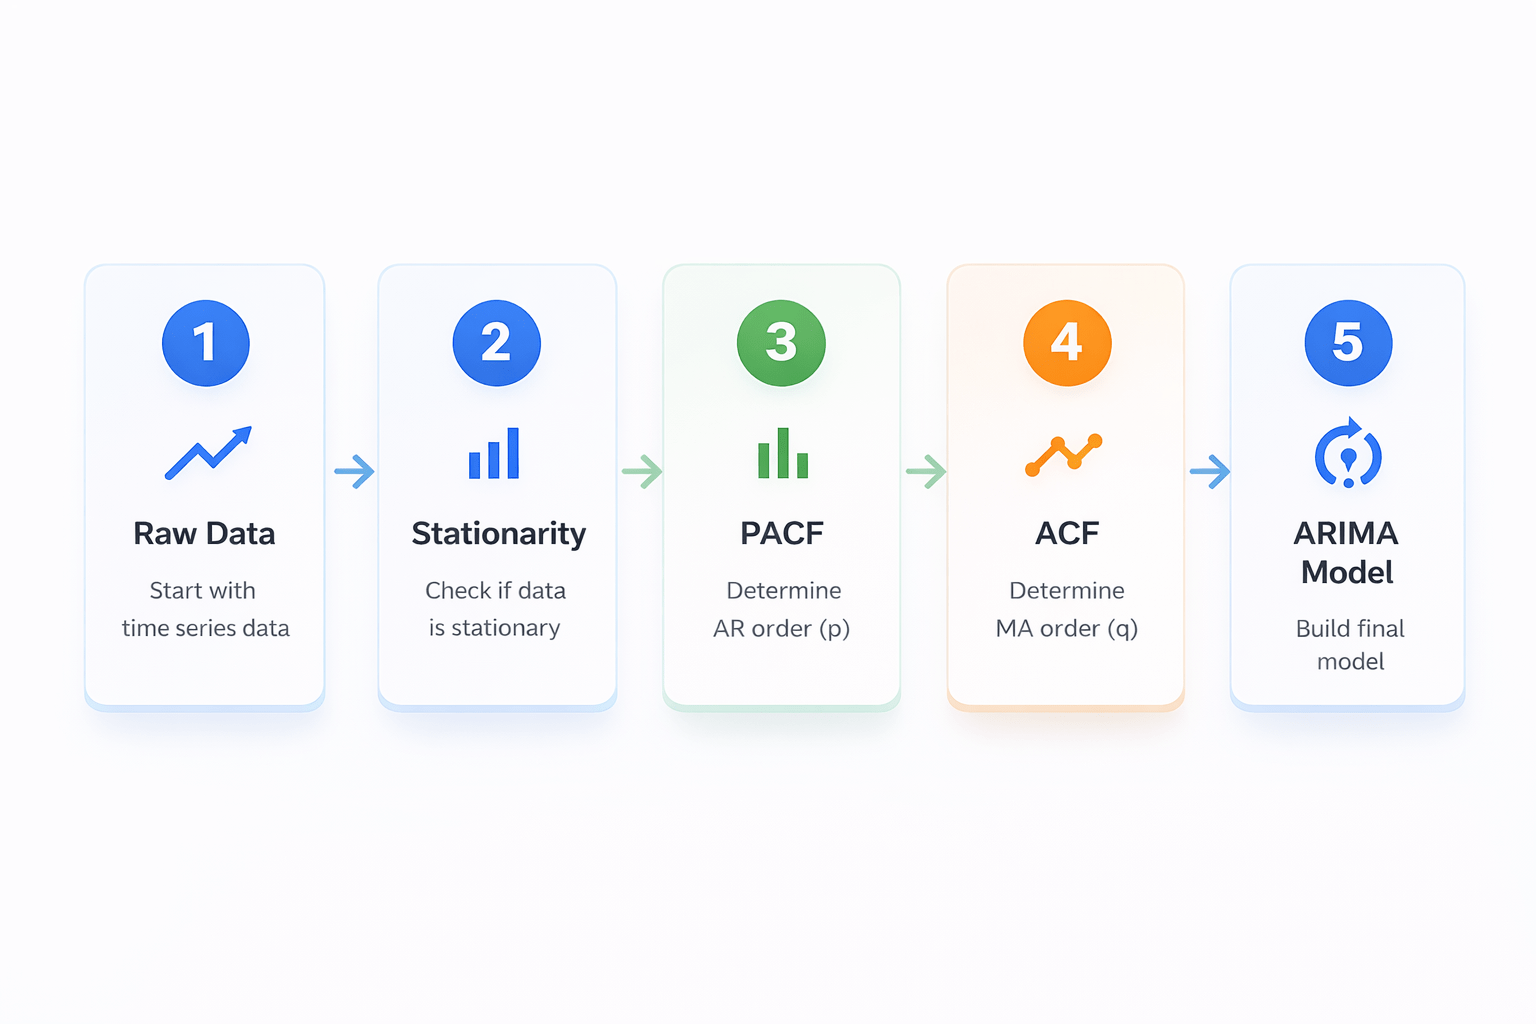
Identification Workflow
How to Find (p, d, q)
Step-by-Step:
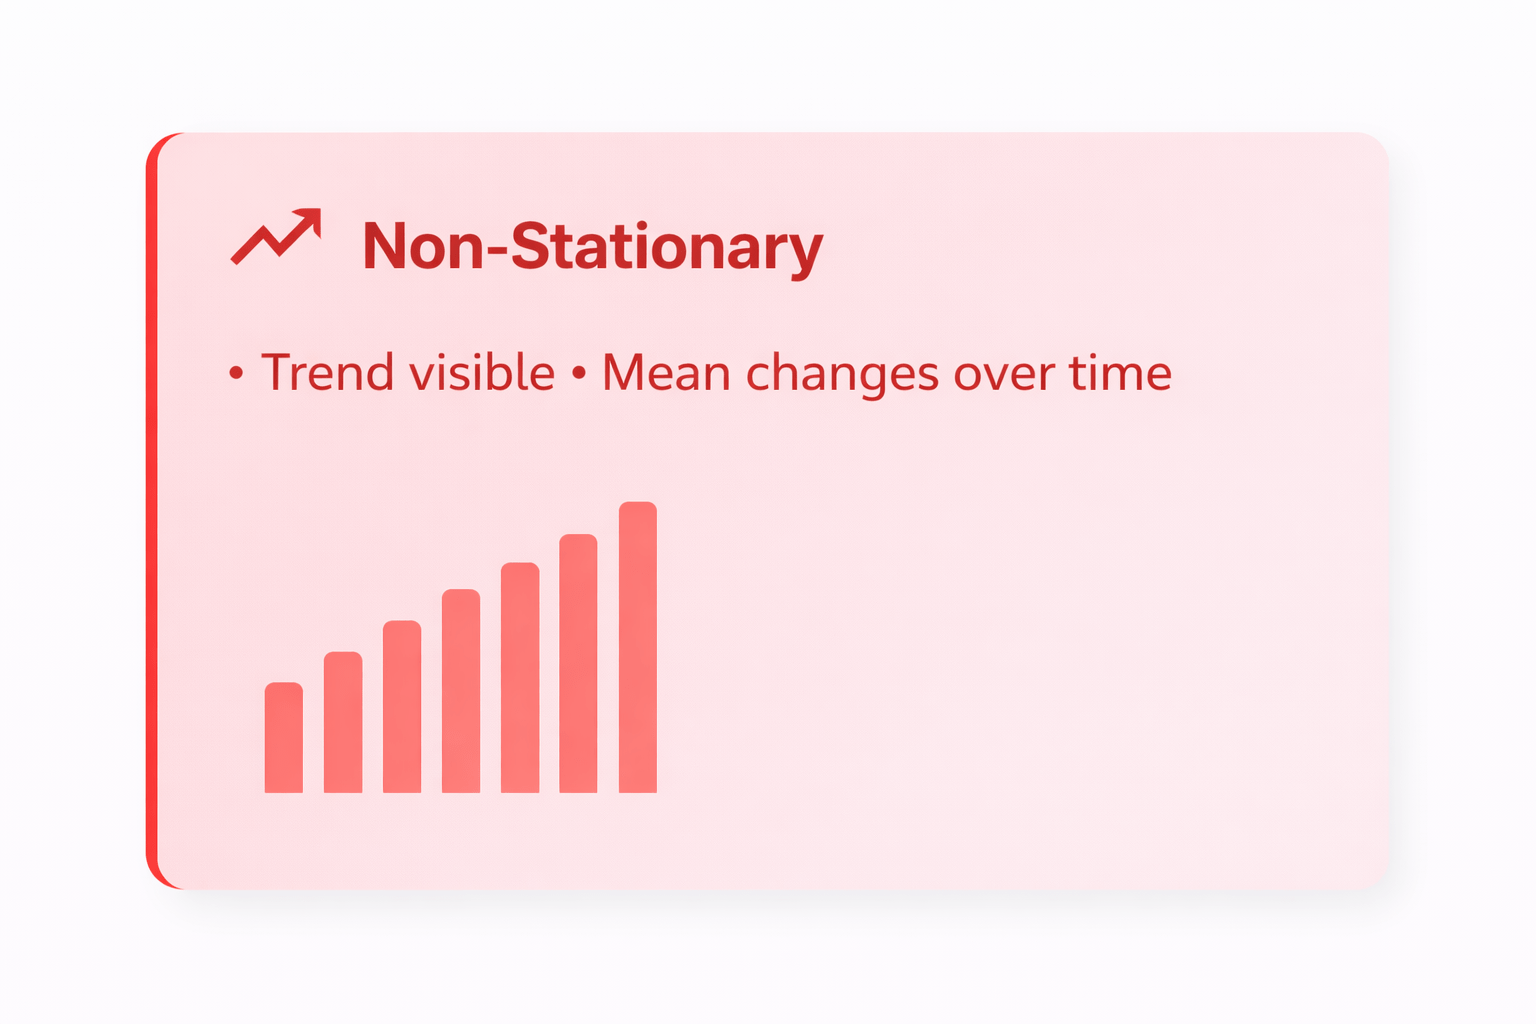
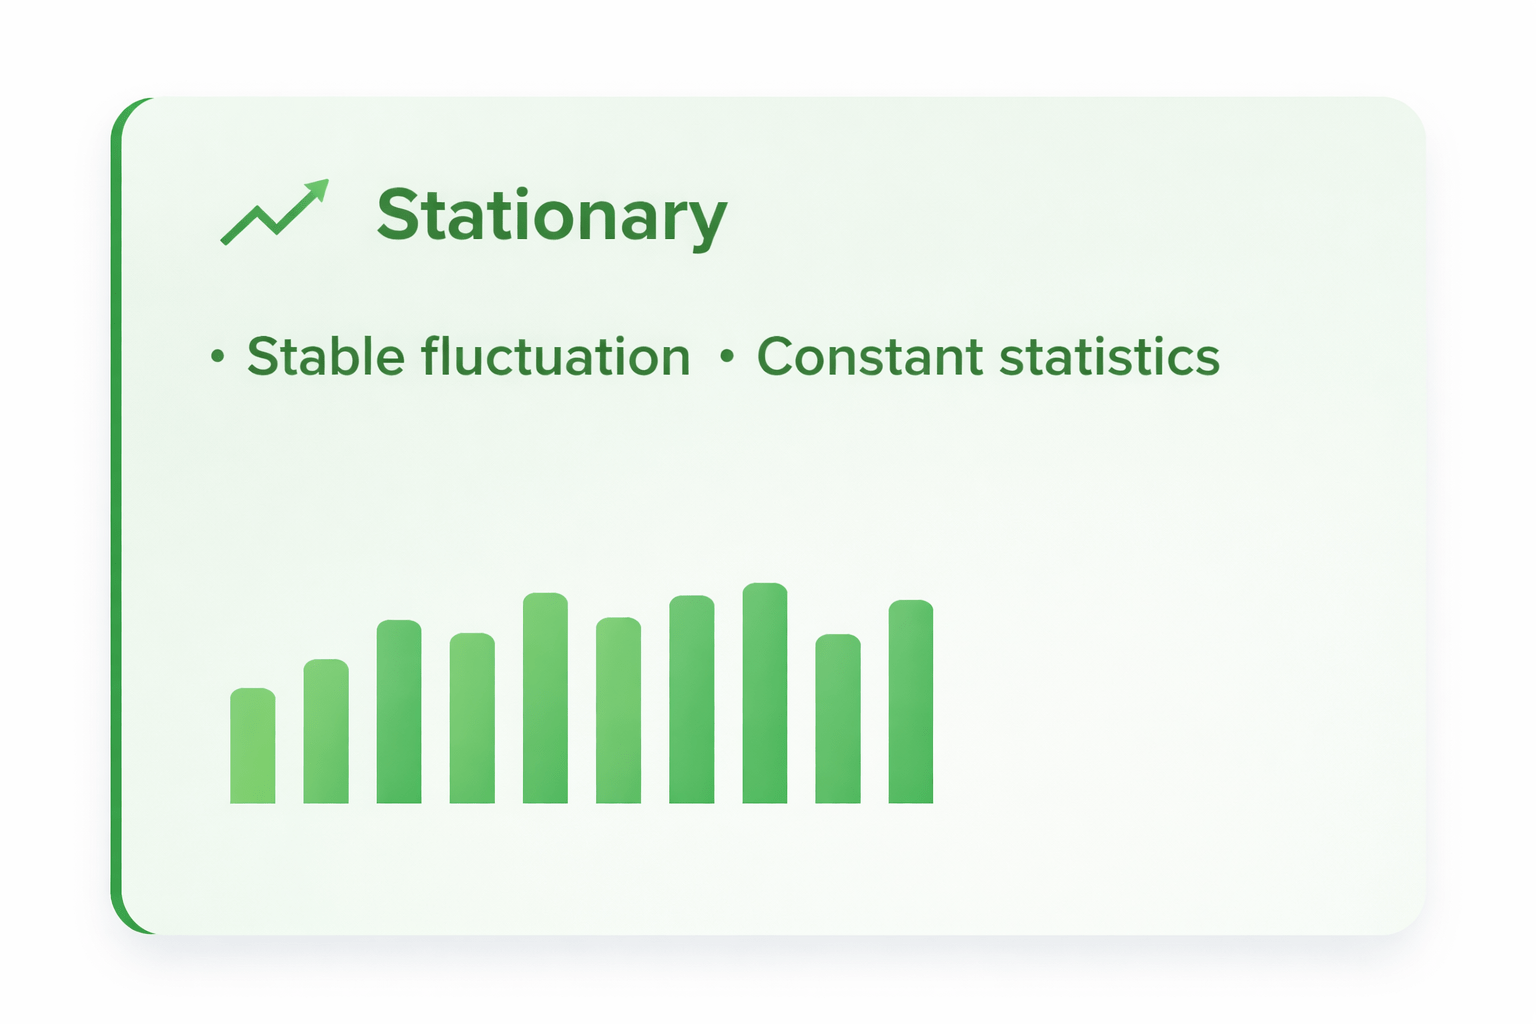
Stationarity Concept
Key Properties:
Constant mean
Constant variance
No long-term trend
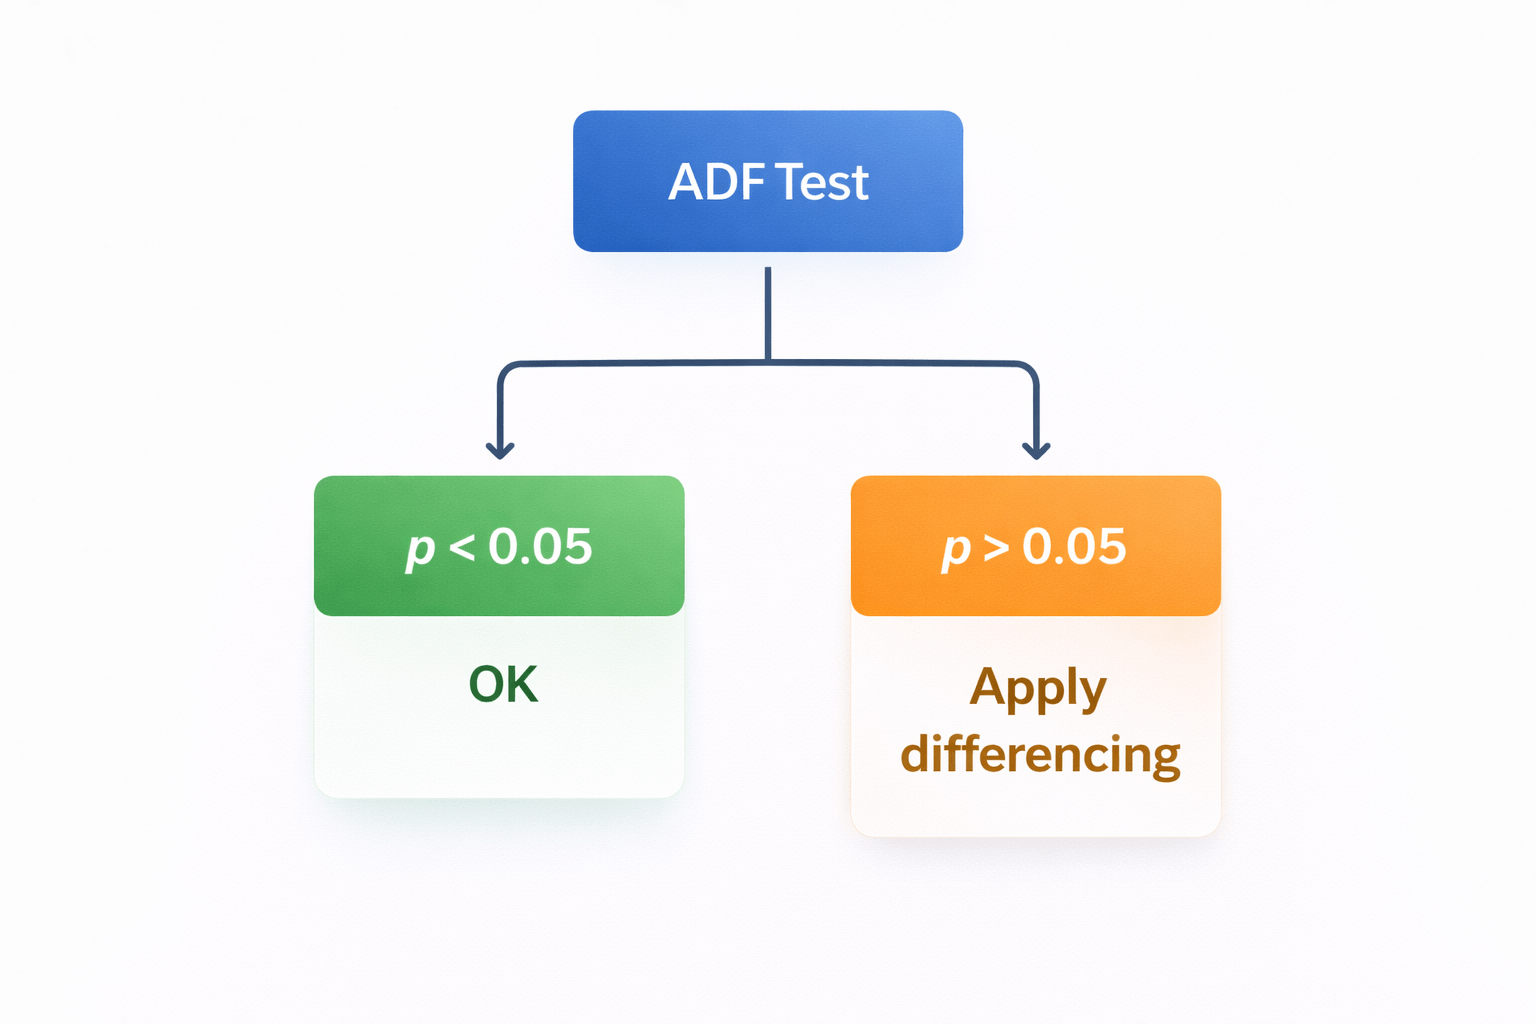
Detecting Stationarity
Augmented Dickey Fuller test
Decision rule:
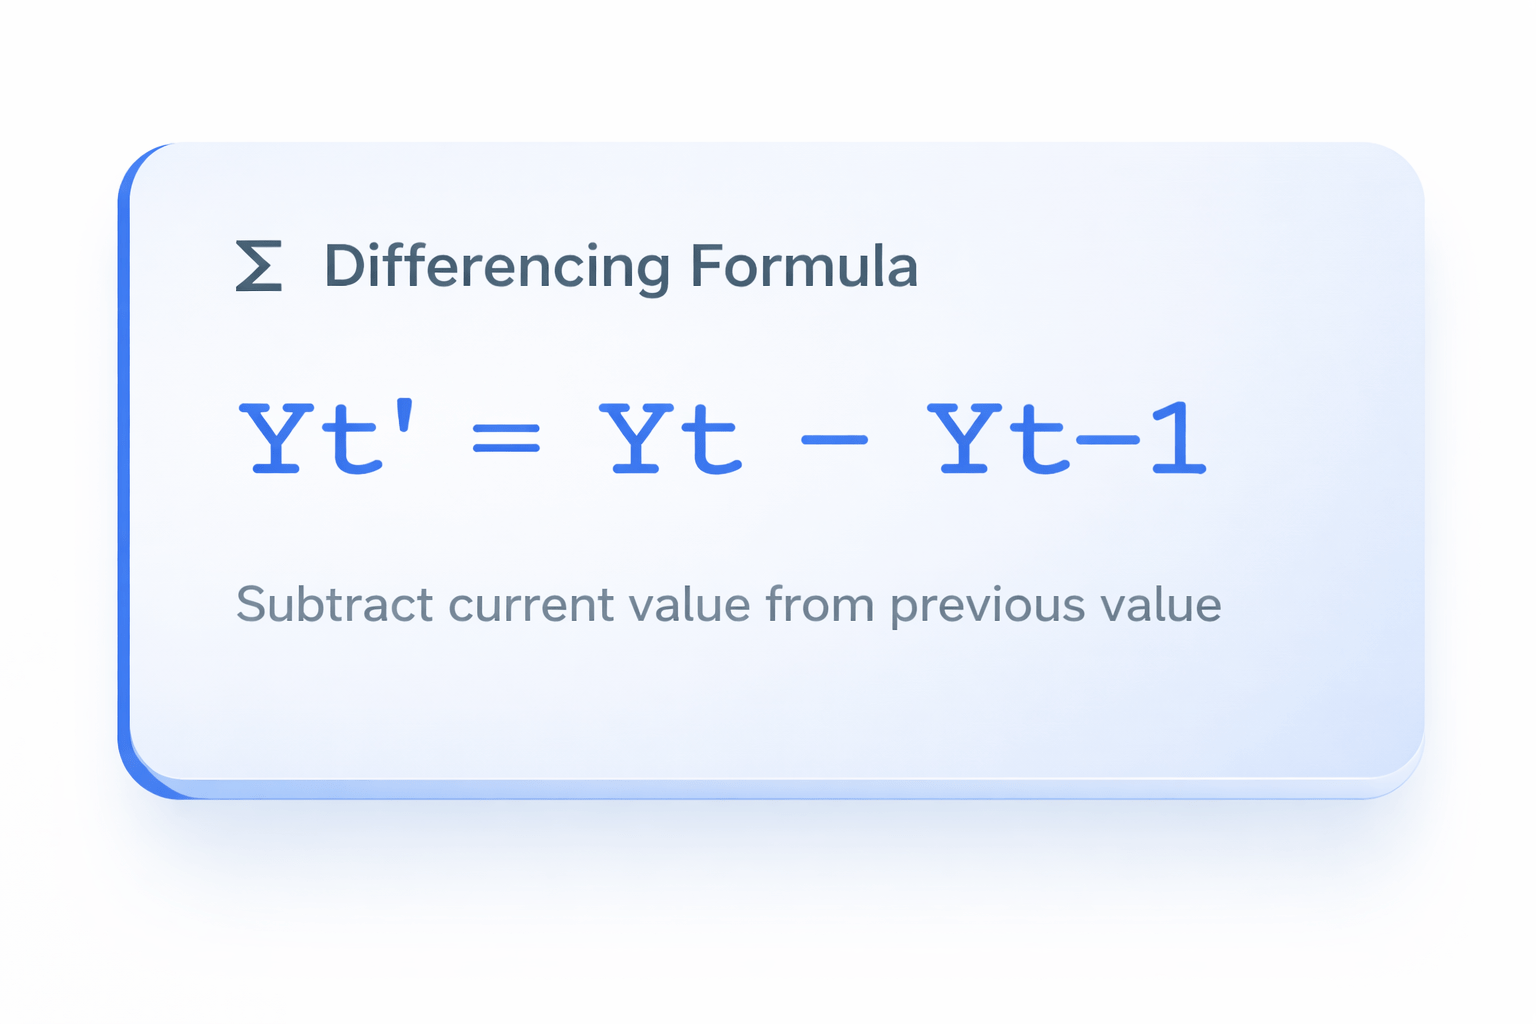
Differencing
Removing Trend
Repeat Until Stationary
Apply differencing operations until the time series becomes stationary. Number of operations = d parameter.
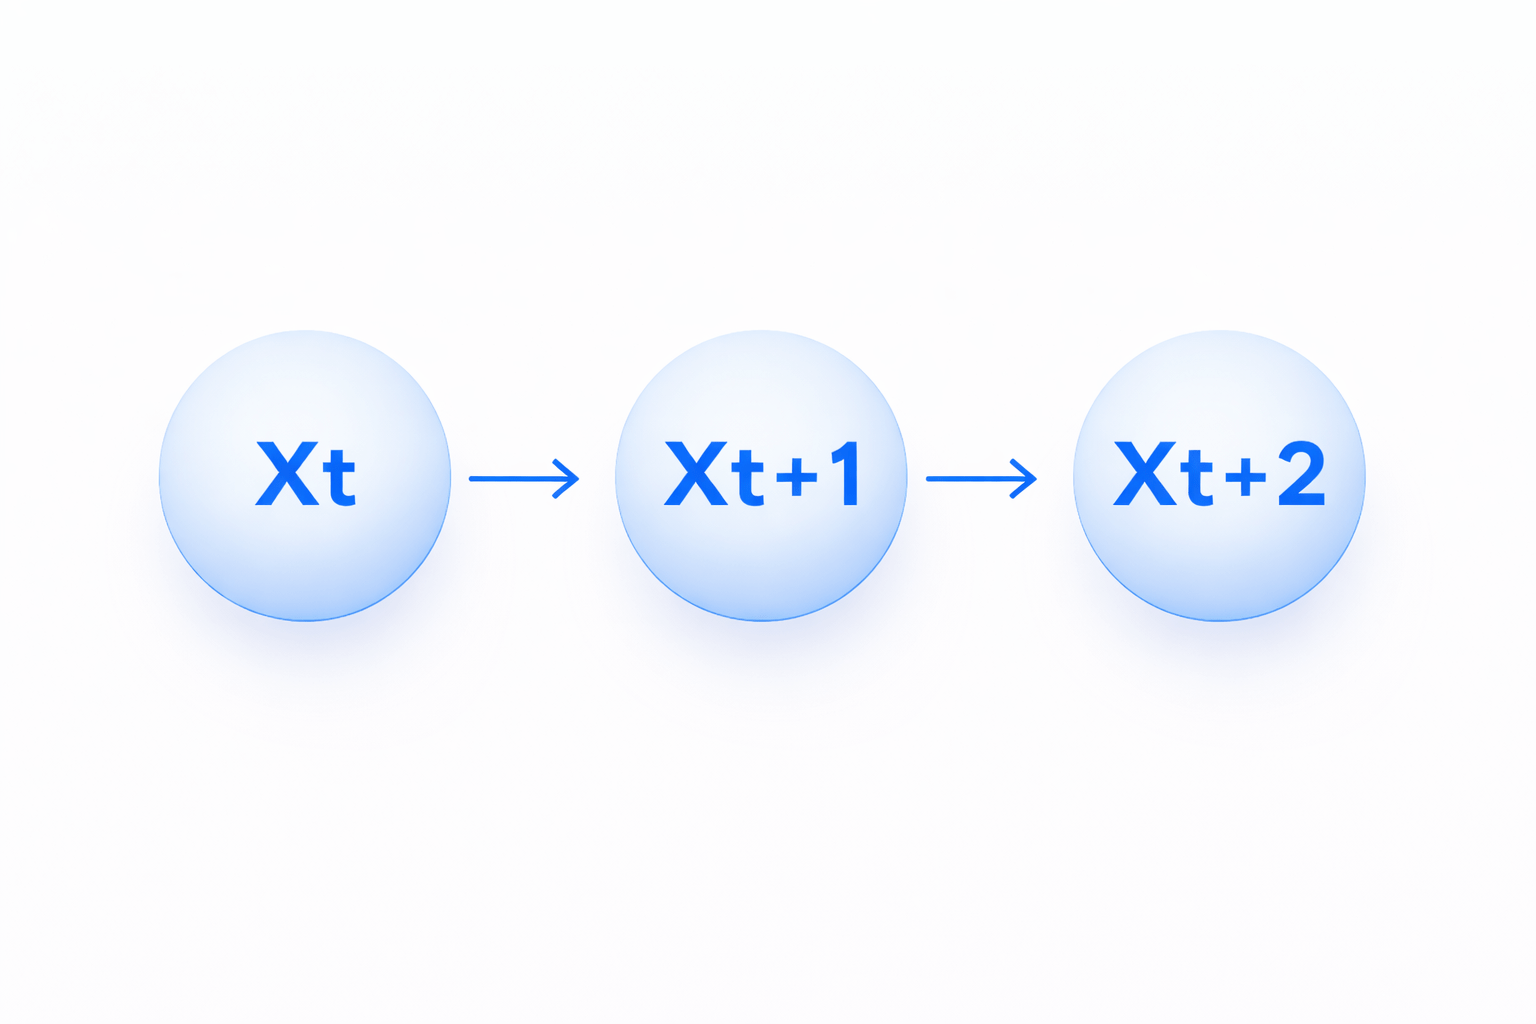
Understanding Autocorrelation
Correlation Between Lags
Key Concept :
Time Series values depends on past values.
Autocorrelation Measures
Today's value correlated with yesterday's value, which correlates with the day before, and so on.
PACF Plot
Summary
5
Auto ARIMA simplifies modeling
4
ACF identifies MA(q)
3
PACF identifies AR(p)
2
d determined by stationarity
1
ARIMA models forecast time series
Quiz
Which plot helps determine AR(p) order?
A. ACF
B. PACF
C. ADF Test
D. Differencing
Quiz-Answer
Which plot helps determine AR(p) order?
A. ACF
B. PACF
C. ADF Test
D. Differencing
By Content ITV


