


Content ITV PRO
This is Itvedant Content department
Learning Outcome
5
Apply yield curves in investing and forecasting.
4
Understand RBI’s influence on short-term yields.
3
Analyze growth, inflation, and rate expectations.
2
Interpret normal, inverted, and flat yield curves.
1
Understand the meaning and structure of the yield curve.
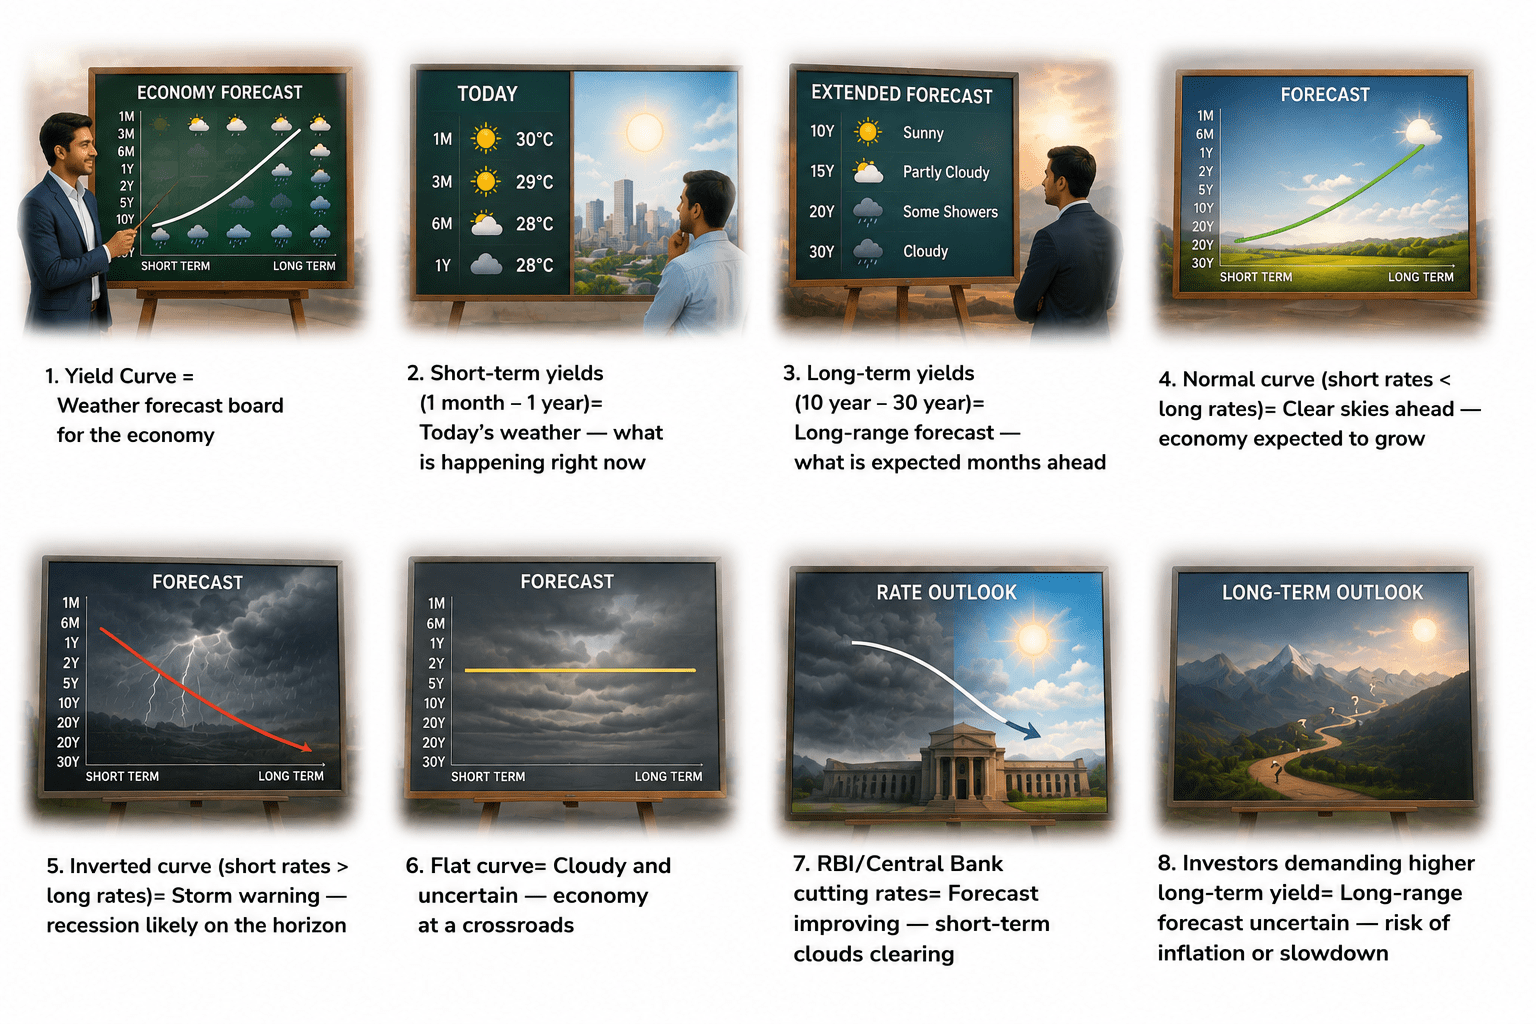
Yield Curve= Weather forecast board for the economy
Short-term yields (1 month – 1 year)= Today's weather — what is happening right now
Long-term yields (10 year – 30 year)=Long-range forecast — what is expected months ahead
Normal curve (short rates < long rates)= Clear skies ahead — economy expected to grow
Investors demanding higher long-term yield= Long-range forecast uncertain — risk of inflation or slowdown
RBI/Central Bank cutting rates= Forecast improving — short-term clouds clearing
Flat curve= Cloudy and uncertain — economy at a crossroads
Inverted curve (short rates > long rates)= Storm warning — recession likely on the horizon
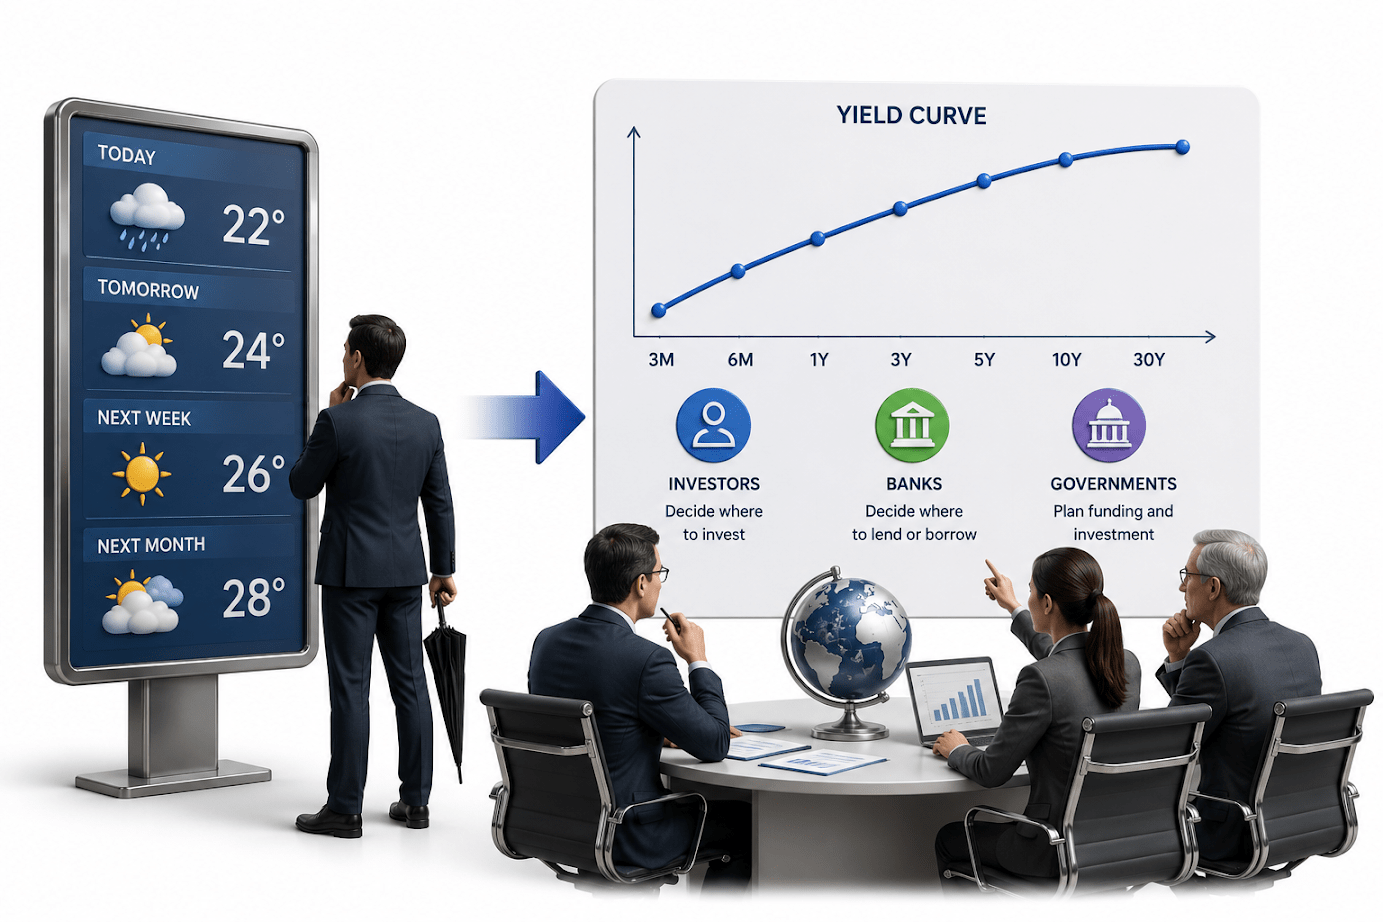
Just as you look at a weather board to decide whether to carry an umbrella today or plan a trip next month, investors, banks, and governments look at the yield curve to decide where to lend, borrow, and invest. The shape of the curve tells you what the 'economic weather' looks like today, and more importantly, what it is expected to be in the future. Now let us plot that board with numbers.
What is the Yield Curve?
The yield curve is a graphical representation that plots the yields (interest rates) of bonds with equal credit quality — typically government bonds against their time to maturity. The X-axis represents maturity (from short-term to long-term) and the Y-axis represents the yield at each maturity.
The Yield Curve Plot
Y-axis: Yield (%) | X-axis: Time to Maturity (months → years → decades)
In India, the yield curve is typically constructed using Government of India (G-Sec) yields — from the 91-day T-bill at the short end to the 40-year G-Sec at the long end. The RBI monitors and influences the short end through its repo rate, while the long end is driven by market forces — inflation expectations, fiscal deficit, and global capital flows.
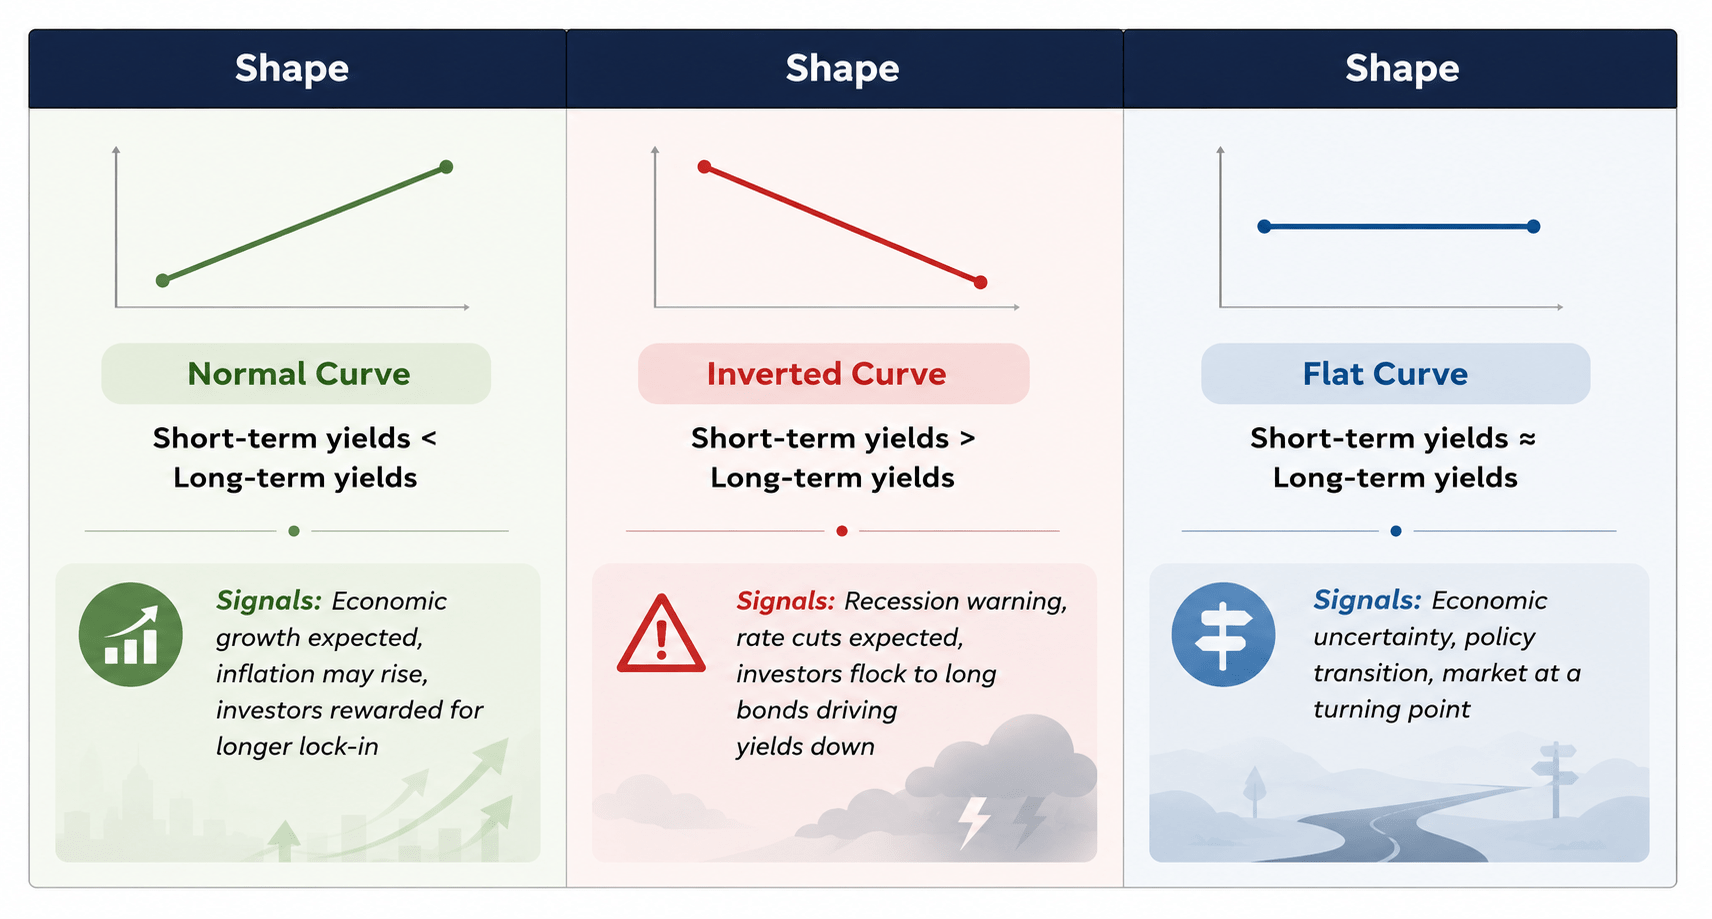
The Three Shapes of the Yield Curve
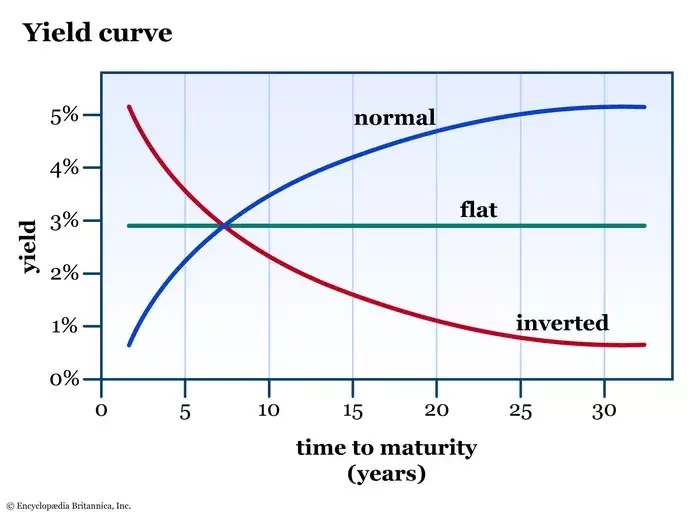
The shape of the yield curve is its most important signal. There are three primary shapes:
Self explanatory image’s link:
https://cdn.britannica.com/65/234865-050-E60BBF49/graphic-three-yield-curves.jpg?w=690
Summary
5
It helps guide investment and policy decisions.
4
An inverted curve may indicate recession.
3
A normal curve signals growth and inflation.
2
It is usually based on government securities.
1
The yield curve shows bond yields across different maturities.
Quiz
Which type of yield curve is considered a recession warning?
A. Normal curve
B. Steep curve
C. Inverted curve
D. Rising curve
Quiz-Answer
Which type of yield curve is considered a recession warning?
A. Normal curve
B. Steep curve
C. Inverted curve
D. Rising curve
By Content ITV


