PayFlow Test Monitoring & Reporting in CI/CD

Business Scenario
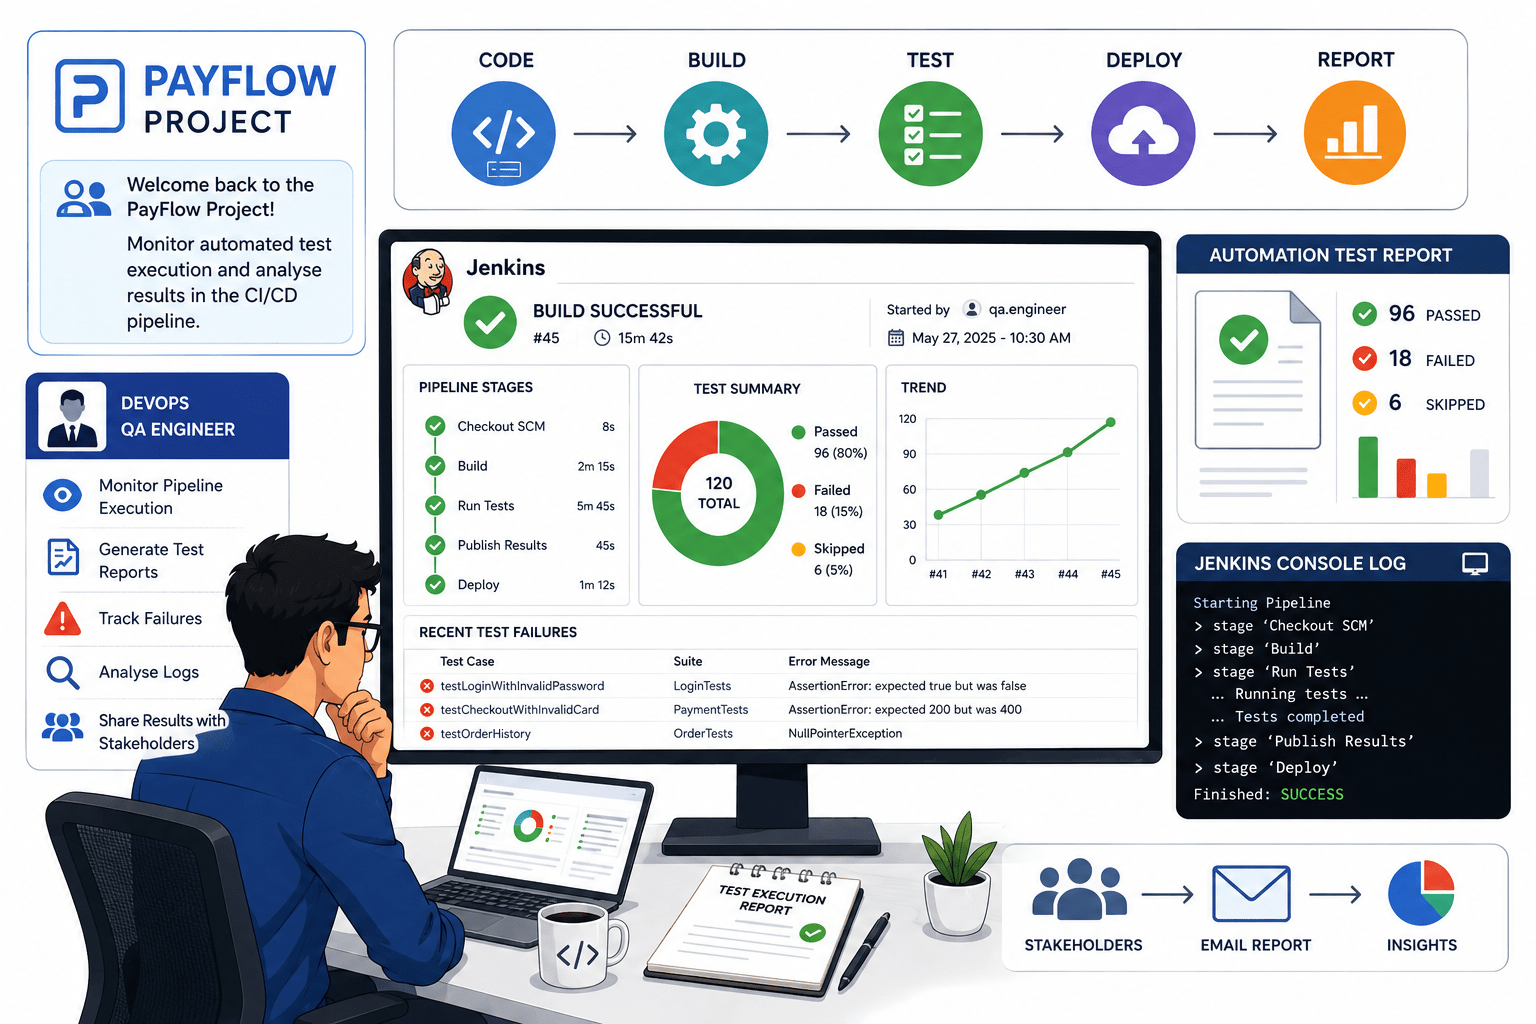
Welcome back to the PayFlow Project. In the previous lab, you analysed application performance using JMeter and documented the performance findings. As a DevOps QA Engineer, your next responsibility is to monitor automated test execution and analyse the results generated during the CI/CD process.

Pre-Lab Preparation
As your QA Manager, I want you to understand that executing tests alone is not enough. Every pipeline execution must be monitored to ensure builds complete successfully, test reports are generated, failures are identified quickly, and logs are analysed to determine the root cause of issues. In this lab, you will monitor Jenkins pipeline execution, generate automation test reports, track failed test cases, and analyse Jenkins console logs. By the end of this lab, you will be able to monitor CI/CD pipelines efficiently and prepare test execution reports for stakeholders.
Topic: AI in Testing
1)Monitor pipeline execution
2)Generate test reports
3)Track failures
4)Analyse logs
git pull origin branchNameGit Pull

Task 1: Monitor Jenkins Pipeline Execution
Learning Objective
The objective of this task is to learn how to monitor a Jenkins pipeline while it is executing. You will understand how Jenkins displays the progress of each stage, monitor build execution in real time, check the build status, and verify whether the PayFlow automation pipeline completes successfully.
Understand Jenkins Pipeline Monitoring
1
Step Objective
Learn what Pipeline Monitoring is and why it is important in a CI/CD environment.
What is Pipeline Monitoring?
Pipeline Monitoring is the process of observing the execution of every stage in a Jenkins pipeline. It helps QA engineers and developers monitor the build process, automated test execution, deployment progress, and final build status.
Instead of manually checking each activity, Jenkins displays the pipeline stages and updates the execution status in real time.
Why is Pipeline Monitoring Required?
Pipeline Monitoring helps to:
-
Track build progress.
-
Monitor automated test execution.
-
Identify failed stages quickly.
-
Reduce manual monitoring effort.
-
Provide continuous feedback to developers and QA teams.
-
Ensure successful software delivery.
Step Objective
Learn what Pipeline Monitoring is and why it is important in a CI/CD environment.
What is Pipeline Monitoring?
Pipeline Monitoring is the process of observing the execution of every stage in a Jenkins pipeline. It helps QA engineers and developers monitor the build process, automated test execution, deployment progress, and final build status.
Instead of manually checking each activity, Jenkins displays the pipeline stages and updates the execution status in real time.
Why is Pipeline Monitoring Required?
Pipeline Monitoring helps to:
-
Track build progress.
-
Monitor automated test execution.
-
Identify failed stages quickly.
-
Reduce manual monitoring effort.
-
Provide continuous feedback to developers and QA teams.
-
Ensure successful software delivery.
How Does It Work?
The monitoring process follows these steps:
-
The developer pushes code to GitHub.
-
Jenkins automatically starts the pipeline.
-
Each stage executes one after another.
-
Jenkins updates the stage status.
-
The build completes with either Success or Failure.
Example (PayFlow Project)
A developer pushes updated Selenium test scripts to the PayFlow GitHub repository.
Jenkins automatically starts the pipeline.
Pipeline Stages:
-
Checkout Source Code
-
Build Project
-
Execute Selenium Tests
-
Generate Test Reports
The QA Engineer monitors each stage from the Jenkins Dashboard until the build completes successfully.
How Does It Work?
The monitoring process follows these steps:
-
The developer pushes code to GitHub.
-
Jenkins automatically starts the pipeline.
-
Each stage executes one after another.
-
Jenkins updates the stage status.
-
The build completes with either Success or Failure.
Example (PayFlow Project)
A developer pushes updated Selenium test scripts to the PayFlow GitHub repository.
Jenkins automatically starts the pipeline.
Pipeline Stages:
-
Checkout Source Code
-
Build Project
-
Execute Selenium Tests
-
Generate Test Reports
The QA Engineer monitors each stage from the Jenkins Dashboard until the build completes successfully.
Activity
-
Introduce AI tools.
-
Demonstrate prompt writing.
-
Show a generated Jenkins pipeline.
Activity
-
Open the Jenkins Dashboard.
-
Observe a running pipeline.
-
Identify each pipeline stage.
-
Record the build status.
-
Open the Jenkins Dashboard.
-
Observe a running pipeline.
-
Identify each pipeline stage.
-
Record the build status.
View Pipeline Execution
2
Step Objective
Learn how to monitor a running pipeline and understand how Jenkins executes each stage.
What is Pipeline Execution?
Pipeline Execution is the process where Jenkins performs all the configured stages automatically after a build is triggered.
Each stage executes sequentially until the pipeline finishes.
Why is Pipeline Execution Important?
It helps to:
-
Verify build progress.
-
Monitor automation execution.
-
Identify delays.
-
Ensure every stage executes correctly.
Step Objective
Learn how to monitor a running pipeline and understand how Jenkins executes each stage.
What is Pipeline Execution?
Pipeline Execution is the process where Jenkins performs all the configured stages automatically after a build is triggered.
Each stage executes sequentially until the pipeline finishes.
Why is Pipeline Execution Important?
It helps to:
-
Verify build progress.
-
Monitor automation execution.
-
Identify delays.
-
Ensure every stage executes correctly.
How Does It Work?
-
Open the Jenkins Dashboard.
-
Select the PayFlow Pipeline.
-
Click Build Now.
-
Observe the running stages.
-
Wait until execution finishes.
Example (PayFlow Project)
The PayFlow pipeline executes the following stages:
-
Checkout
-
Maven Build
-
Selenium Test Execution
-
Generate Reports
Each stage changes colour while running and displays its execution result.
-
Selenium Test Execution
-
Generate Reports
Each stage changes colour while running and displays its execution result.
Activity
-
Demonstrate Build Now.
-
Explain the execution flow.
-
Show running pipeline.
Activity
-
Start the pipeline.
-
Observe execution.
-
Record completed stages.
Understand Pipeline Stages
3
What is AI Pipeline Generation?
AI Pipeline Generation uses AI tools to create a Jenkinsfile based on project requirements automatically.
How Does It Work?
-
Describe the project requirements.
-
Ask AI to generate the Jenkinsfile.
-
Review the generated stages.
-
Modify the script if required.
-
Save the Jenkinsfile.
Example (PayFlow Project)
Prompt:
"Create a Jenkins Declarative Pipeline for the PayFlow project using Maven and Selenium."
AI generates:
-
Checkout
-
Build
-
Test
-
Publish Reports
What is AI Pipeline Generation?
AI Pipeline Generation uses AI tools to create a Jenkinsfile based on project requirements automatically.
How Does It Work?
-
Describe the project requirements.
-
Ask AI to generate the Jenkinsfile.
-
Review the generated stages.
-
Modify the script if required.
-
Save the Jenkinsfile.
Example (PayFlow Project)
Prompt:
"Create a Jenkins Declarative Pipeline for the PayFlow project using Maven and Selenium."
AI generates:
-
Checkout
-
Build
-
Test
-
Publish Reports
Activity
-
Demonstrate pipeline generation.
-
Explain each pipeline stage.
Activity
-
Generate the pipeline.
-
Review the stages.
-
Save the script.
Understand Pipeline Stages
3
Step Objective
Learn the purpose of each stage in the Jenkins pipeline.
What are Pipeline Stages?
Pipeline Stages divide the CI/CD process into smaller logical activities.
Each stage performs one specific task.
Common stages include:
-
Checkout
-
Build
-
Test
-
Deploy
-
Report
Why are Pipeline Stages Required?
Pipeline Stages help to:
-
Organise the build process.
-
Simplify debugging.
-
Track execution progress.
-
Improve pipeline readability.
Step Objective
Learn the purpose of each stage in the Jenkins pipeline.
What are Pipeline Stages?
Pipeline Stages divide the CI/CD process into smaller logical activities.
Each stage performs one specific task.
Common stages include:
-
Checkout
-
Build
-
Test
-
Deploy
-
Report
Why are Pipeline Stages Required?
Pipeline Stages help to:
-
Organise the build process.
-
Simplify debugging.
-
Track execution progress.
-
Improve pipeline readability.
How Does It Work?
Example Pipeline Flow:
Developer Pushes Code
↓
GitHub Repository
↓
Checkout Stage
↓
Build Stage
↓
Test Stage
↓
Report Stage
↓
Pipeline Complete
How Does It Work?
Example Pipeline Flow:
Developer Pushes Code
↓
GitHub Repository
↓
Checkout Stage
↓
Build Stage
↓
Test Stage
↓
Report Stage
↓
Pipeline Complete
Example (PayFlow Project)
Pipeline Stages:
Checkout
Downloads source code from GitHub.
Build
Compiles the Maven project.
Test
Executes Selenium automation scripts.
Report
Publishes JUnit test reports.
Activity
-
Explain each stage.
-
Demonstrate Stage View
Activity
-
Observe every stage.
-
Identify the function of each stage.
Check Build Status
4
Step Objective
Learn how to verify the final build result after pipeline execution.
What is Build Status?
Build Status indicates whether the pipeline executed successfully or failed.
Common build statuses include:
-
Success ✅
-
Failed ❌
-
Running ⏳
-
Aborted ⚪
Step Objective
Learn how to verify the final build result after pipeline execution.
What is Build Status?
Build Status indicates whether the pipeline executed successfully or failed.
Common build statuses include:
-
Success
-
Failed
-
Running
-
Aborted
Why is Build Status Important?
Build Status helps to:
-
Verify successful execution.
-
Detect build failures.
-
Track project quality.
-
Provide quick feedback.
How Does It Work?
After pipeline execution:
Green ✔ → Success
Red ✖ → Failure
Blue/Animated → Running
Grey → Aborted
Why is Build Status Important?
Build Status helps to:
-
Verify successful execution.
-
Detect build failures.
-
Track project quality.
-
Provide quick feedback.
How Does It Work?
After pipeline execution:
Green ✔ → Success
Red ✖ → Failure
Blue/Animated → Running
Grey → Aborted
Example (PayFlow Project)
The PayFlow pipeline finishes with a Success status because:
-
Maven Build completed.
-
Selenium Tests passed.
-
Reports generated successfully.
Activity
-
Demonstrate different build statuses.
-
Explain status colours.
Activity
-
Observe build status.
-
Record the final result.
Verify Pipeline Completion
5
Step Objective
Learn how to verify that the pipeline has completed successfully before moving to report analysis.
What is Pipeline Completion Verification?
Pipeline Completion Verification ensures that all stages have finished successfully and all expected outputs are generated.
Why is Verification Required?
Verification helps to:
-
Confirm build completion.
-
Verify test execution.
-
Ensure reports are generated.
-
Prepare for failure analysis.
Step Objective
Learn how to verify that the pipeline has completed successfully before moving to report analysis.
What is Pipeline Completion Verification?
Pipeline Completion Verification ensures that all stages have finished successfully and all expected outputs are generated.
Why is Verification Required?
Verification helps to:
-
Confirm build completion.
-
Verify test execution.
-
Ensure reports are generated.
-
Prepare for failure analysis.
How Does It Work?
-
Check Build History.
-
Verify all stages are completed.
-
Confirm test reports generated.
-
Review Build Number.
-
Record pipeline completion.
How Does It Work?
-
Check Build History.
-
Verify all stages are completed.
-
Confirm test reports generated.
-
Review Build Number.
-
Record pipeline completion.
Activity
-
Verify Build History.
-
Confirm completed stages.
-
Record the Build Number.
-
Prepare for report generation.
Activity
-
Demonstrate build verification.
-
Explain Build History.
-
Show completed pipeline.
Task 2: Debug CI/CD Failures Using AI
Step Objective
Learn what automation test reports are and why they are important in a CI/CD pipeline.
What are Automation Test Reports?
Automation Test Reports are documents generated automatically after test execution. They provide information about the number of test cases executed, passed, failed, skipped, execution time, and overall build quality.
Jenkins generates these reports after running automation test scripts and makes them available on the Jenkins Dashboard.
Understand Automation Test Reports
1
Learning Objective
The objective of this task is to learn how Jenkins generates automation test reports after executing automated test cases. You will understand different report formats, publish JUnit and HTML reports, analyse test execution results, and verify whether the PayFlow automation tests have passed or failed.
Why are Automation Test Reports Required?
Automation Test Reports help to:
-
Verify whether test execution was successful.
-
Identify passed and failed test cases.
-
Measure test execution time.
-
Share test results with developers and stakeholders.
-
Support faster debugging and defect analysis.
How Does It Work?
-
Jenkins starts the pipeline.
-
Selenium automation tests are executed.
-
Test results are generated.
-
Jenkins publishes the reports.
-
QA Engineers review the reports to verify the test results.
Example (PayFlow Project)
After executing the PayFlow automation suite:
-
Total Test Cases: 25
-
Passed: 23
-
Failed: 2
-
Skipped: 0
Jenkins automatically generates a report displaying these results.
Activity
-
Explain the purpose of automation test reports.
-
Show a sample report.
-
Discuss the importance of reporting in CI/CD.
Activity
-
Explain the purpose of automation test reports.
-
Show a sample report.
-
Discuss the importance of reporting in CI/CD.
-
Observe the generated report.
-
Identify the number of passed and failed test cases.
-
Record the execution summary.
Step Objective
Learn how Jenkins generates a JUnit Report after automation test execution.
What is a JUnit Report?
A JUnit Report is an XML-based report that contains the results of automated test execution. Jenkins reads this report and displays the test execution summary on the dashboard.
Why is a JUnit Report Required?
JUnit Reports help to:
-
Display automation test results.
-
Show passed and failed test cases.
-
Monitor execution trends.
-
Improve debugging.
Generate JUnit Test Report
2
Step Objective
Learn how Jenkins generates a JUnit Report after automation test execution.
What is a JUnit Report?
A JUnit Report is an XML-based report that contains the results of automated test execution. Jenkins reads this report and displays the test execution summary on the dashboard.
Why is a JUnit Report Required?
JUnit Reports help to:
-
Display automation test results.
-
Show passed and failed test cases.
-
Monitor execution trends.
-
Improve debugging.
How Does It Work?
-
Execute the Jenkins Pipeline.
-
Selenium generates JUnit XML files.
-
Jenkins reads the XML files.
-
Jenkins displays the test summary.
Example (PayFlow Project)
JUnit Report:
-
Total Tests: 25
-
Passed: 23
-
Failed: 2
-
Duration: 3 Minutes
Activity
-
Demonstrate JUnit report generation.
-
Explain report sections.
-
Show failed test details.
Activity
-
Open the JUnit Report.
-
Verify test execution statistics.
-
Identify failed test cases.
Generate HTML Test Report
3
Step Objective
Learn how to publish and view HTML reports generated after automation testing.
What is an HTML Report?
An HTML Report is a graphical report that presents automation test execution results in a user-friendly format. It includes charts, execution summaries, screenshots (if configured), and detailed test information.
Why is an HTML Report Required?
HTML Reports help to:
-
Present test results clearly.
-
Improve report readability.
-
Share reports with stakeholders.
-
Analyse failed test cases.
How Does It Work?
-
Execute the automation tests.
-
Generate the HTML report.
-
Jenkins publishes the report.
-
Open the report from the Jenkins Dashboard.
Example (PayFlow Project)
The HTML report displays:
-
Test Summary
-
Pass Percentage
-
Fail Percentage
-
Execution Time
-
Failed Test Details
Activity
-
Demonstrate HTML report generation.
-
Explain report sections.
-
Show navigation through the report.
Activity
-
Open the HTML report.
-
Review the execution summary.
-
Observe graphical results.
Analyse Test Execution Results
4
Step Objective
Learn how to analyse the results of automated test execution using Jenkins reports.
What is Test Result Analysis?
Test Result Analysis is the process of reviewing automation reports to determine which test cases passed, failed, or were skipped.
Why is Test Result Analysis Required?
It helps to:
-
Verify application quality.
-
Identify failed test cases.
-
Detect recurring defects.
-
Support release decisions.
Step Objective
Learn how to analyse the results of automated test execution using Jenkins reports.
What is Test Result Analysis?
Test Result Analysis is the process of reviewing automation reports to determine which test cases passed, failed, or were skipped.
Why is Test Result Analysis Required?
It helps to:
-
Verify application quality.
-
Identify failed test cases.
-
Detect recurring defects.
-
Support release decisions.
How Does It Work?
-
Open the Jenkins report.
-
Review the execution summary.
-
Check passed, failed, and skipped tests.
-
Analyse execution time.
-
Record observations.
Example (PayFlow Project)
Execution Summary:
| Test Result | Count |
|---|---|
| Passed | 23 |
| Failed | 2 |
| Skipped | 0 |
| Total | 25 |
| Test Result | Count |
|---|---|
| Passed | 23 |
| Failed | 2 |
| Skipped | 0 |
| Total | 25 |
The two failed test cases require further investigation.
Activity
-
Demonstrate report analysis.
-
Explain how to interpret test results.
-
Discuss common failure reasons.
-
Analyse the report.
-
Record passed and failed test cases.
-
Identify any issues.
Activity
Step Objective
Learn how to verify generated reports and save them for documentation and future reference.
What is Report Verification?
Report Verification is the process of confirming that all required reports have been generated correctly and contain accurate test execution information.
Why is Report Verification Required?
Verification helps to:
-
Ensure report accuracy.
-
Confirm successful report generation.
-
Maintain testing records.
-
Share reports with stakeholders
Verify and Save Test Reports
5
Example (PayFlow Project)
The QA Engineer confirms that:
-
✅ JUnit Report Generated
-
✅ HTML Report Generated
-
✅ Test Summary Available
-
✅ Failed Test Cases Listed
-
✅ Reports Ready for Review
Example (PayFlow Project)
The QA Engineer confirms that:
-
JUnit Report Generated
-
HTML Report Generated
-
Test Summary Available
-
Failed Test Cases Listed
-
Reports Ready for Review
Activity
-
Demonstrate report verification.
-
Explain how to archive reports in Jenkins.
-
Discuss report-sharing best practices.
-
Analyse the report.
-
Record passed and failed test cases.
-
Identify any issues.
Activity
-
Verify the generated reports.
-
Save the reports.
-
Document the execution summary.
-
Prepare for failure analysis in the next task
Task 3: Track Build and Test Failures
Learning Objective
The objective of this task is to learn how to identify build failures and test failures in a Jenkins CI/CD pipeline. You will understand the common causes of failures, analyse failed test cases, perform root cause analysis, and document the findings to improve the quality of the PayFlow application.
Understand Build and Test Failures
1
Step Objective
Learn what build failures and test failures are, and understand why they occur during CI/CD pipeline execution.
What are Build and Test Failures?
A Build Failure occurs when Jenkins is unable to complete the build process due to issues such as compilation errors, missing dependencies, or configuration problems.
A Test Failure occurs when one or more automated test cases fail because the application's actual behaviour does not match the expected behaviour.
Step Objective
Learn what build failures and test failures are, and understand why they occur during CI/CD pipeline execution.
Why are Build and Test Failures Important?
Tracking failures helps to:
-
Detect defects early.
-
Improve software quality.
-
Prevent faulty code from moving to production.
-
Reduce debugging time.
-
Provide quick feedback to developers.
How Does It Work?
-
Jenkins executes the pipeline.
-
The project is built using Maven.
-
Selenium automation tests are executed.
-
Jenkins marks the build as Success or Failed.
-
QA Engineers review the failure details.
How Does It Work?
-
Jenkins executes the pipeline.
-
The project is built using Maven.
-
Selenium automation tests are executed.
-
Jenkins marks the build as Success or Failed.
-
QA Engineers review the failure details.
Example (PayFlow Project)
During the PayFlow pipeline execution:
-
Maven Build: Successful
-
Selenium Tests Executed: 25
-
Passed: 23
-
Failed: 2
Jenkins marks the build as Unstable because two test cases failed.
Activity
-
Explain the difference between build failures and test failures.
-
Demonstrate a failed pipeline.
-
Discuss common reasons for failures.
Activity
-
Explain the difference between build failures and test failures.
-
Demonstrate a failed pipeline.
-
Discuss common reasons for failures.
Activity
-
Observe the pipeline execution.
-
Identify whether the failure occurred during the build or testing phase.
-
Record the pipeline status.
Identify Failed Test Cases
2
Step Objective
Learn how to locate and identify failed test cases using Jenkins test reports.
What are Failed Test Cases?
Failed test cases are automation tests that do not produce the expected results during execution. Jenkins displays these failures in the JUnit or HTML reports.
Why is Identifying Failed Test Cases Required?
It helps to:
-
Detect application defects.
-
Verify functionality.
-
Improve software quality.
-
Support defect reporting.
How Does It Work?
-
Open the Jenkins Dashboard.
-
Select the latest build.
-
Open the Test Results section.
-
Review failed test cases.
-
Record failure details.
Example (PayFlow Project)
The test report shows:
| Test Case | Status |
|---|---|
| Login Test | Passed |
| Payment Test | Failed |
| Transaction History Test | Passed |
| Refund Test | Failed |
The Payment Test and Refund Test require investigation
Activity
-
Demonstrate how to open the Test Report.
-
Explain failed test details.
-
Show execution history.
-
Open the Test Report.
-
Identify failed test cases.
-
Record the failure information.
Activity
-
Open the Test Report.
-
Identify failed test cases.
-
Record the failure information.
Activity
Perform Root Cause Analysis
3
Step Objective
Learn how to identify the actual reason behind build or test failures.
What is Root Cause Analysis (RCA)?
Root Cause Analysis (RCA) is the process of finding the main reason for a failure instead of only identifying its symptoms.
Why is Root Cause Analysis Required?
It helps to:
-
Resolve issues permanently.
-
Improve build stability.
-
Prevent repeated failures.
-
Reduce maintenance effort
How Does It Work?
-
Open Jenkins Console Output.
-
Review error messages.
-
Identify the failed stage.
-
Determine the root cause.
-
Document the findings.
Example (PayFlow Project)
The Payment Test failed because the payment API returned an HTTP 500 Internal Server Error, causing the automation script to fail.
Activity
-
Demonstrate Console Output analysis.
-
Explain common build and test errors.
-
Discuss debugging techniques.
Activity
Demonstrate Console Output analysis.
Explain common build and test errors.
Discuss debugging techniques.
What is AI Workflow Optimisation?
AI Workflow Optimisation is the process of using AI tools to analyse an existing CI/CD pipeline and suggest improvements that make the pipeline faster, more efficient, and easier to maintain.
Instead of manually reviewing every pipeline stage, AI analyses the workflow and recommends optimisation techniques.
How Does It Work?
-
Review the existing Jenkins pipeline.
-
Share the pipeline configuration with an AI tool.
-
AI analyses the workflow.
-
AI suggests improvements.
-
Apply the recommended optimisations.
Example (PayFlow Project)
The PayFlow pipeline contains multiple unnecessary build steps that increase execution time.
The QA Engineer shares the Jenkinsfile with ChatGPT.
AI recommends:
-
Removing duplicate build commands.
-
Running independent tasks in parallel.
-
Optimising pipeline stages.
Activity
-
Explain workflow optimisation.
-
Demonstrate AI analysis of a Jenkins pipeline.
-
Discuss optimisation benefits.
Activity
-
Review the PayFlow pipeline.
-
Use AI to analyse the workflow.
-
Record AI recommendations.
-
Prepare the Workflow Optimisation Report.
-
Compare pipeline performance before and after optimisation.
-
Submit the report for evaluation.
Great job!
Congratulations! You have completed the PayFlow AI-Assisted CI/CD Optimisation & Debugging lab. In this lab, you learned how AI supports DevOps by assisting with Jenkins pipeline configuration, analysing CI/CD failures, optimising workflows, and improving automation testing efficiency. You also explored how AI can reduce manual effort, speed up troubleshooting, and improve software quality. These skills will help you build smarter and more efficient CI/CD pipelines using modern AI-powered DevOps practices.
Checkpoint
Git Push
git push origin branchNameNext-Lab Preparation
Git Push
git push origin branchNameTopic: DevOps for Q
1)Use AI for pipeline configuration
2)Debug CI/CD failures using AI
3)Optimise workflows
4)Improve test efficiency