


Daniel Haehn PRO
Hi, I am a biomedical imaging and visualization researcher who investigates how computational methods can accelerate biological and medical research.
iTCGA: Visualization and Medical Imaging
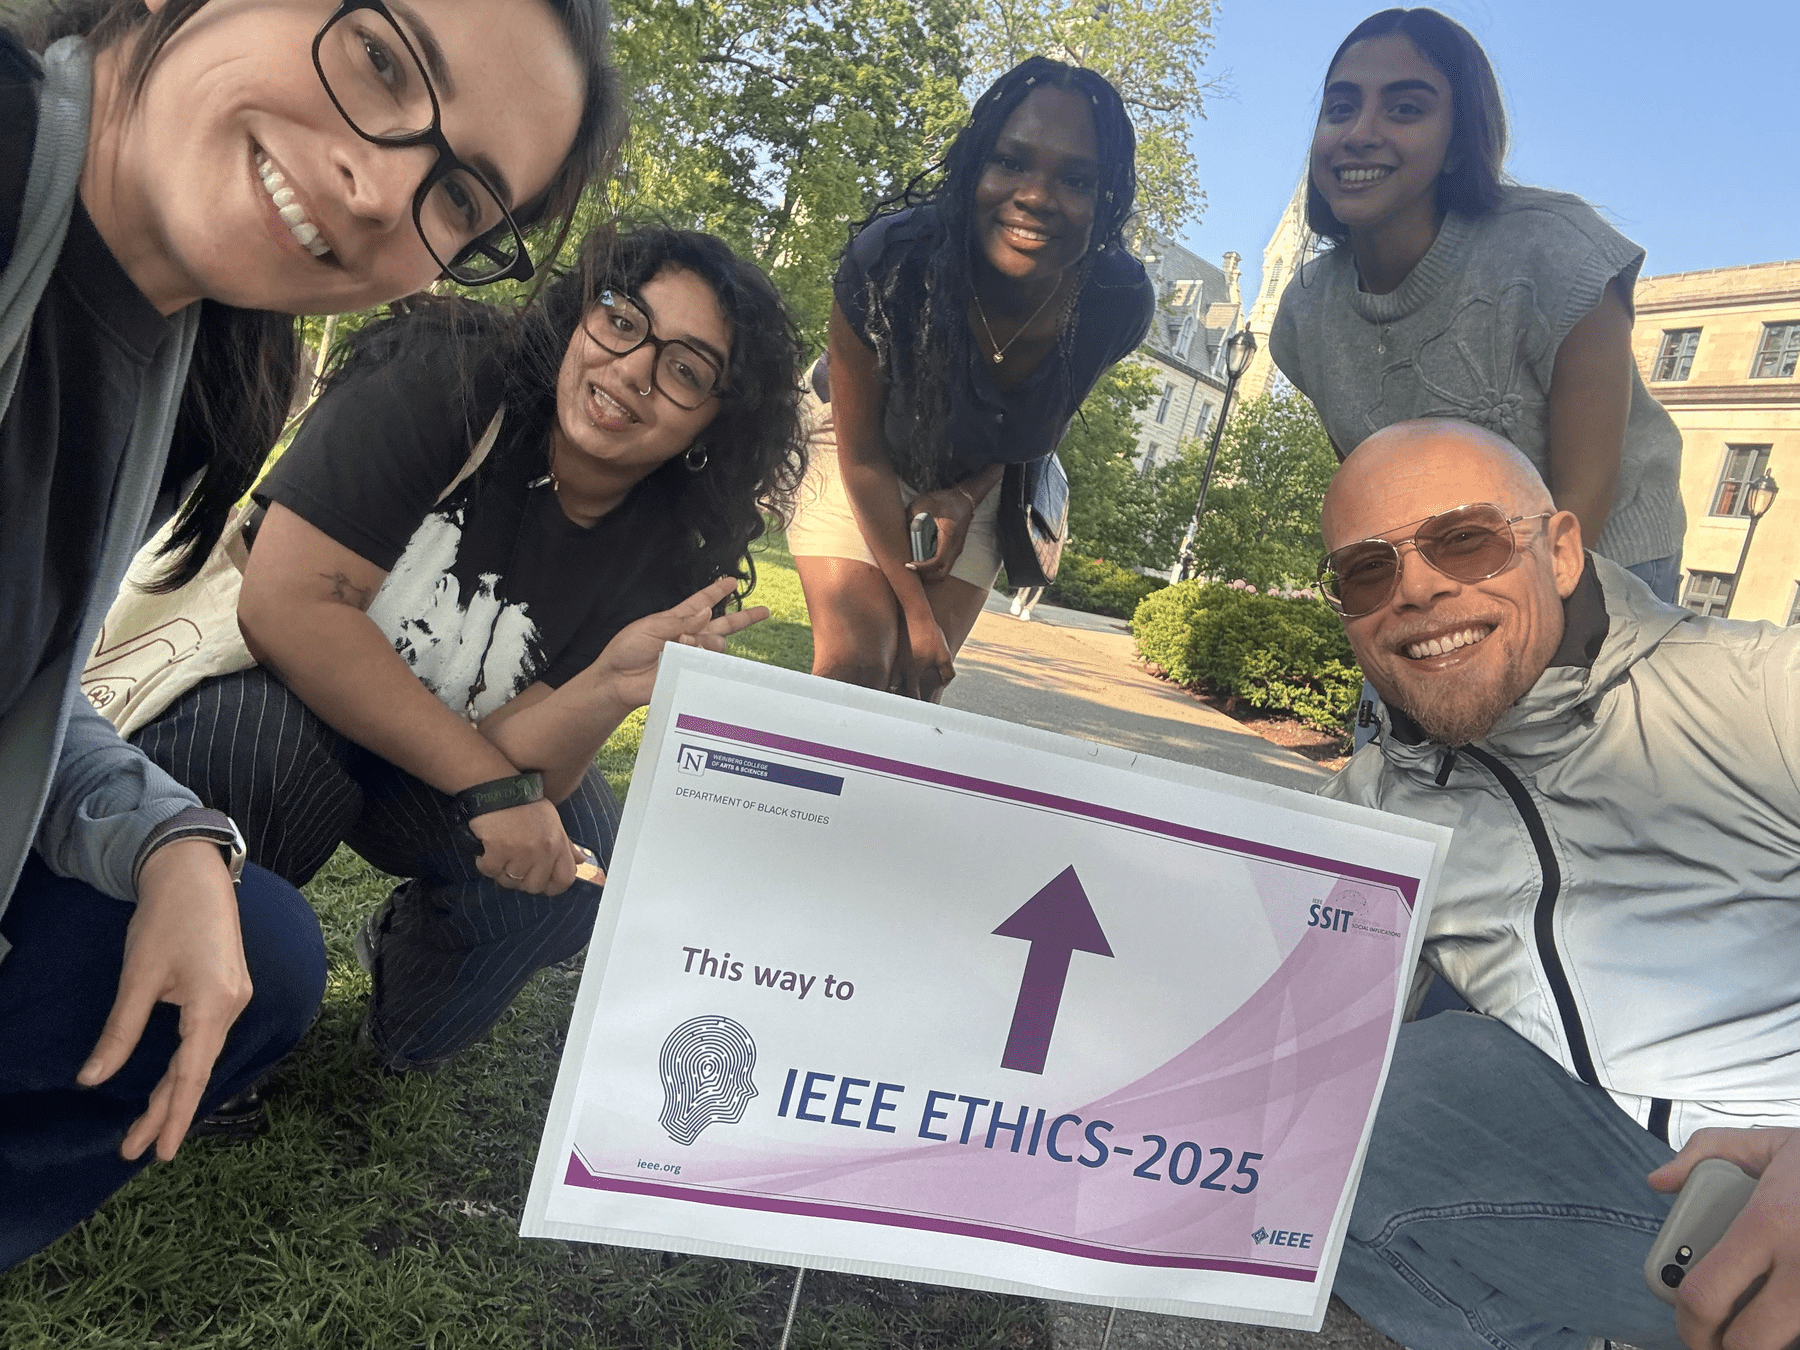
BIWOC Research Hub
of
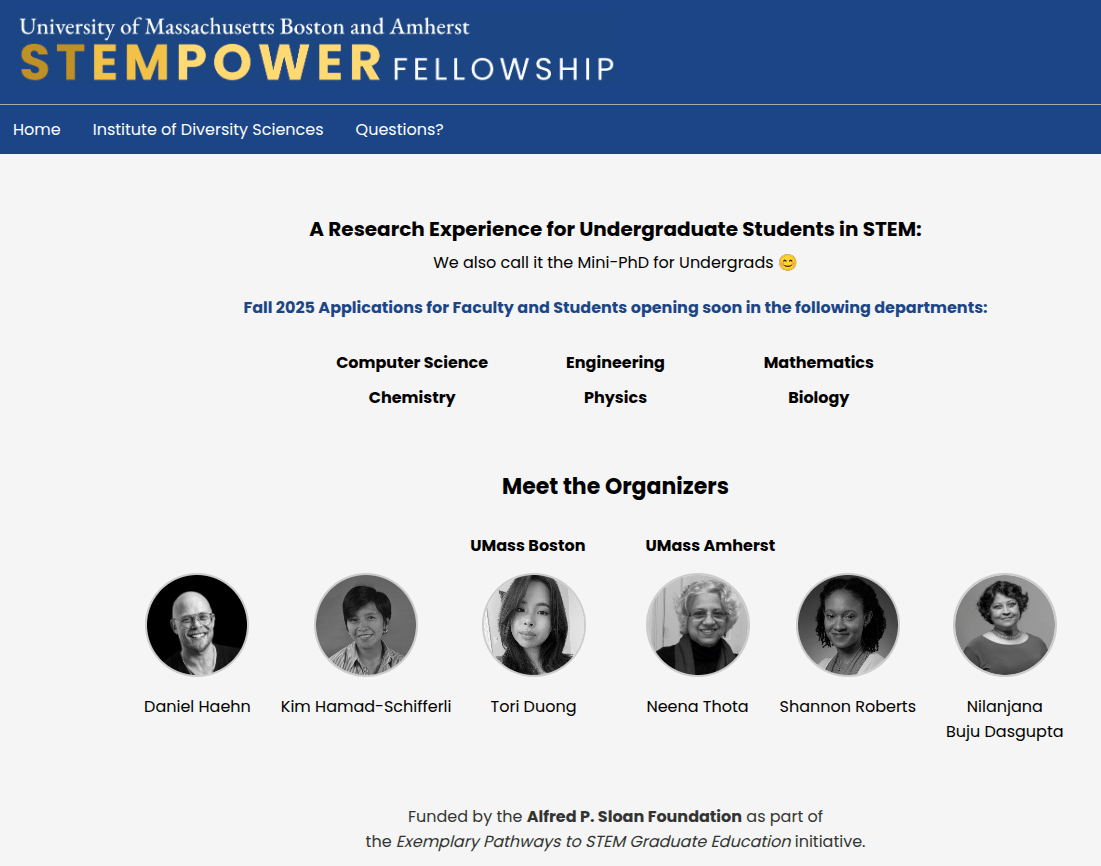
Research Experience for Undergraduate Students in CS and Engineering
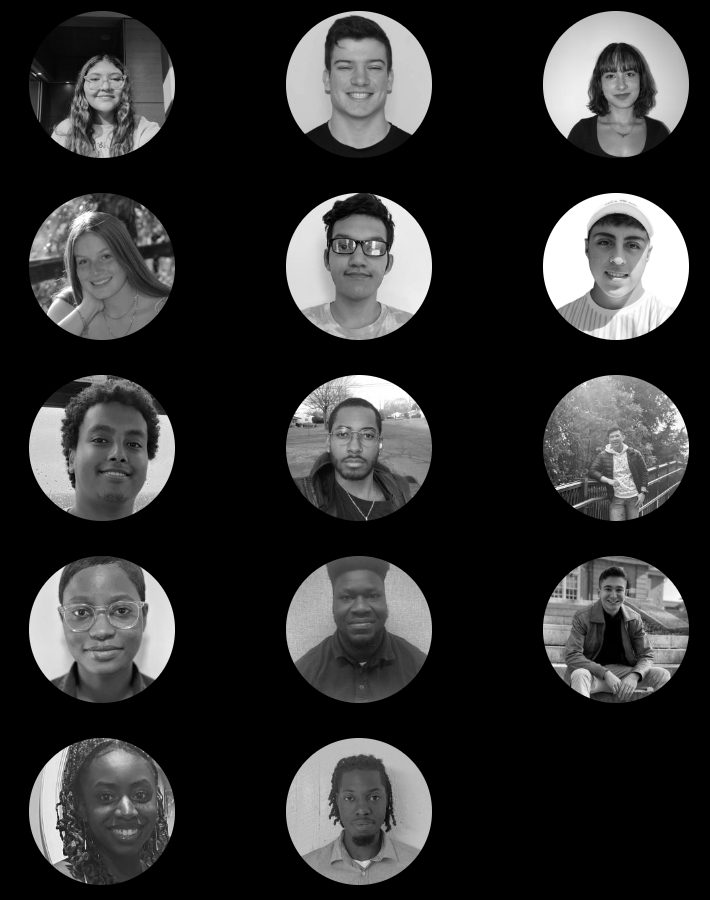
2023 Students
2024 Students
The Mini-PhD!
5+
7+
accepted papers
grad school applications
Daniel Haehn
MACHINE
PSYCHOLOGY
DANIELHAEHN.COM
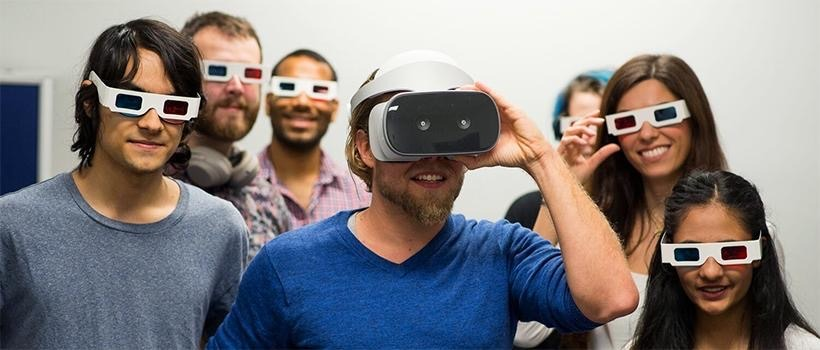
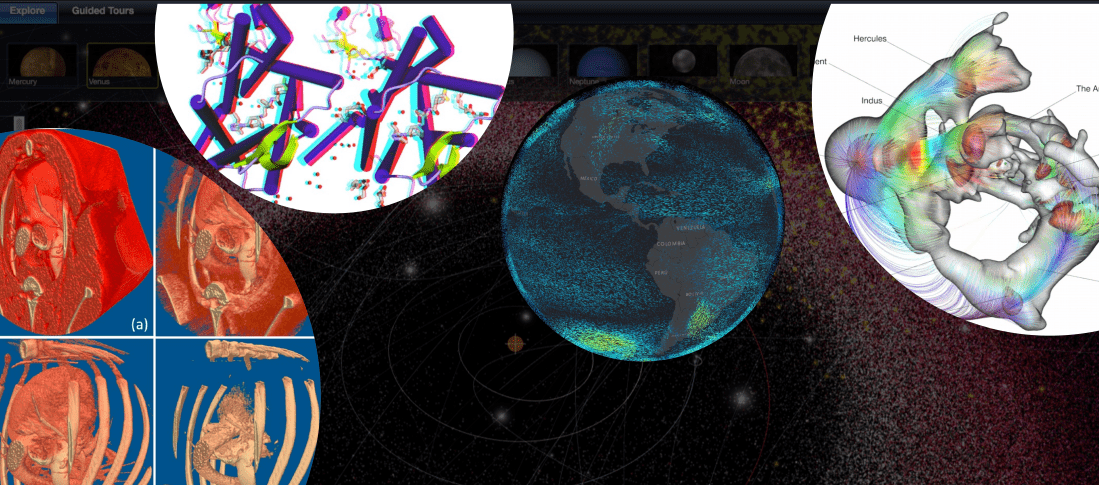
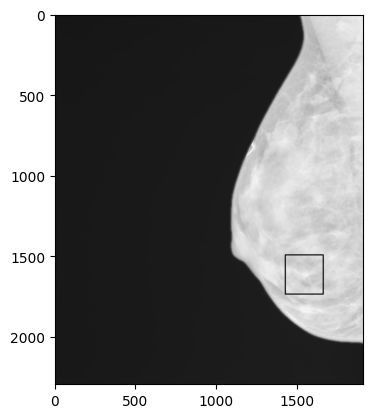
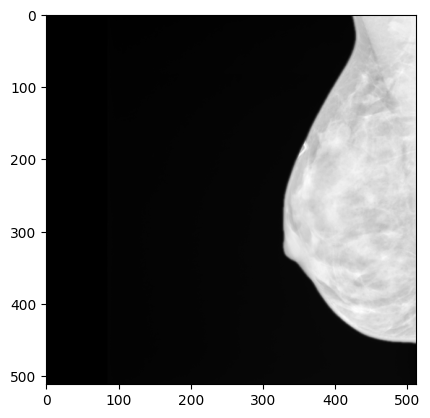
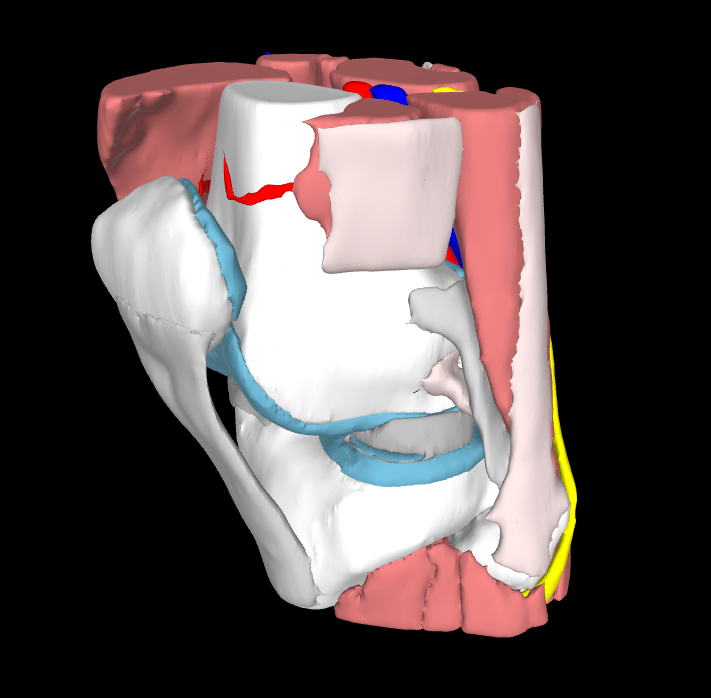
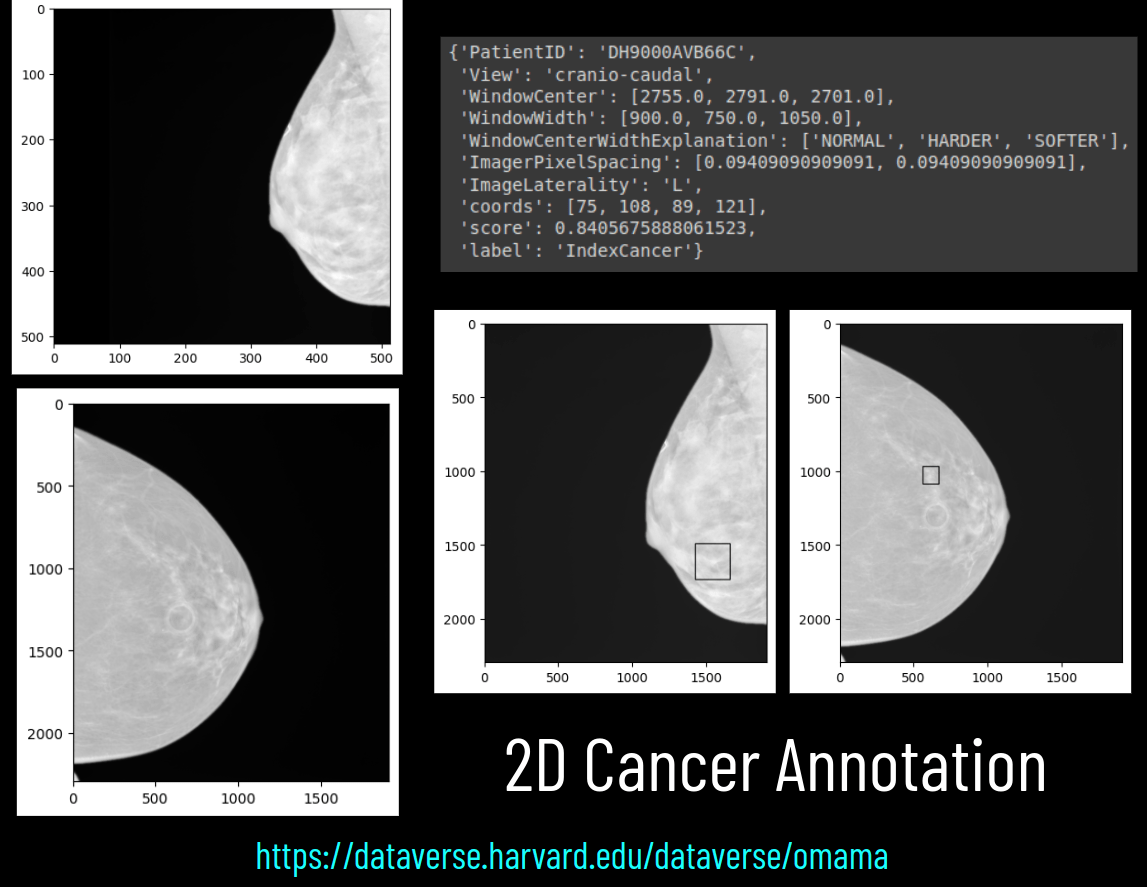
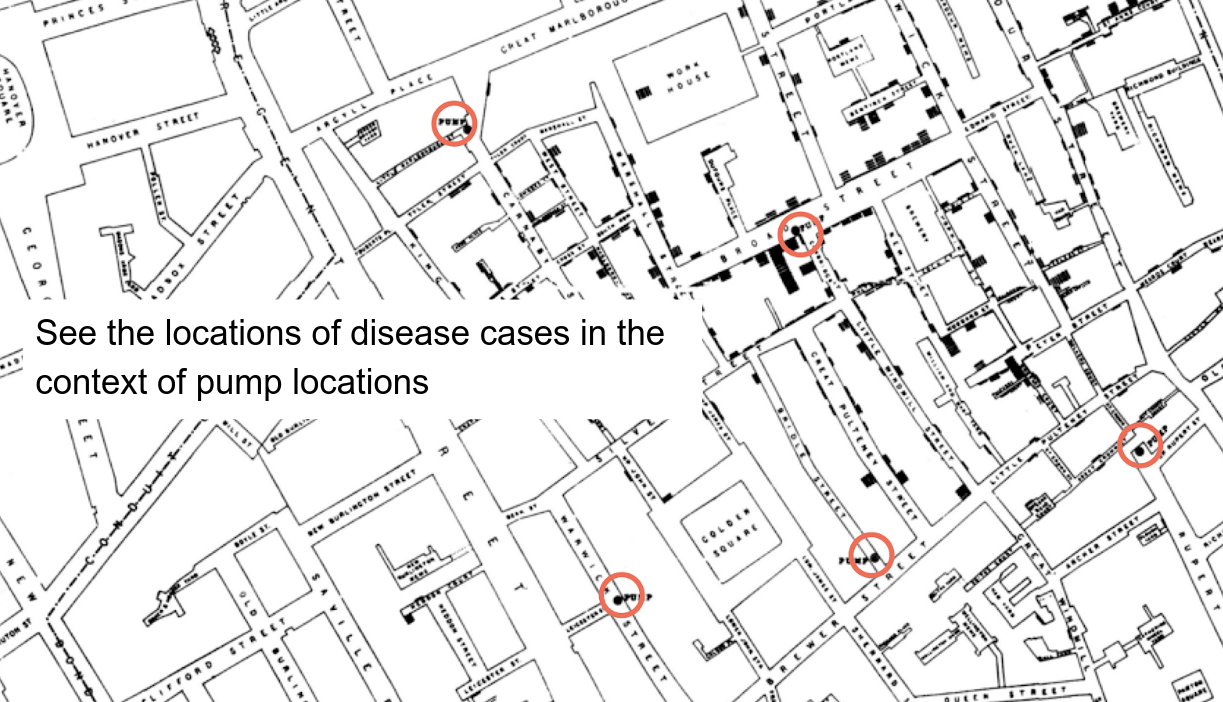
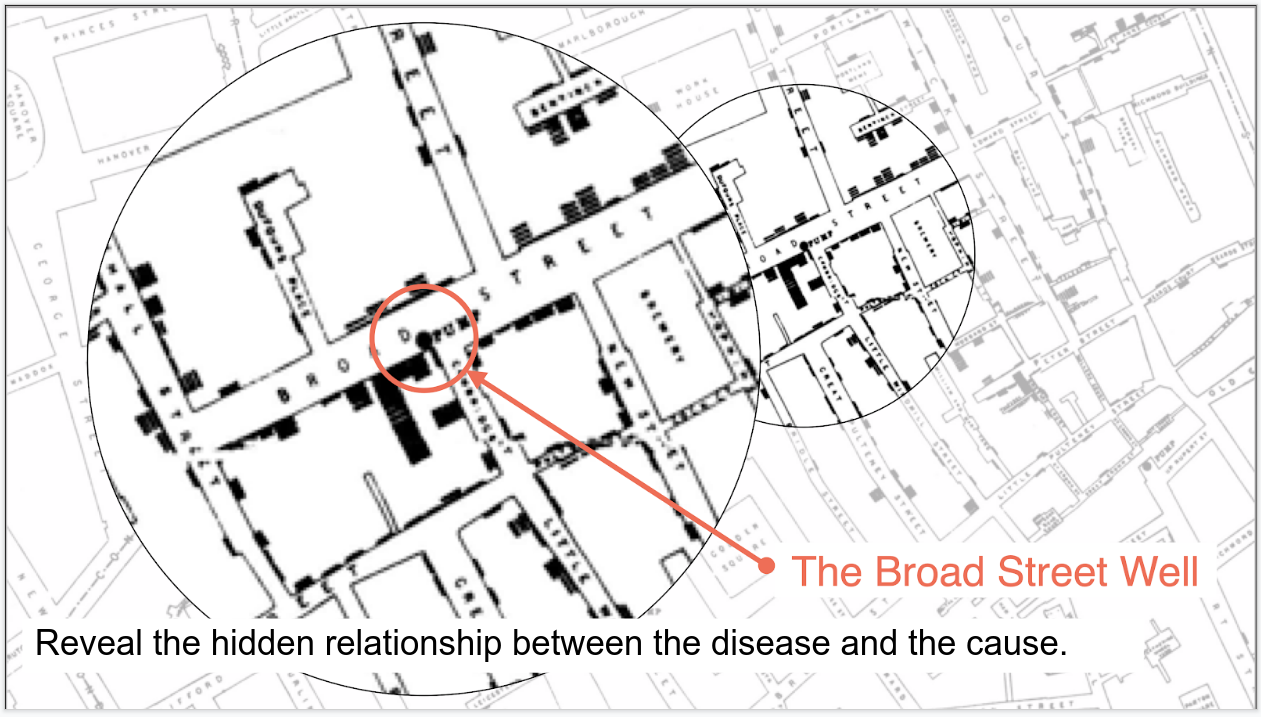
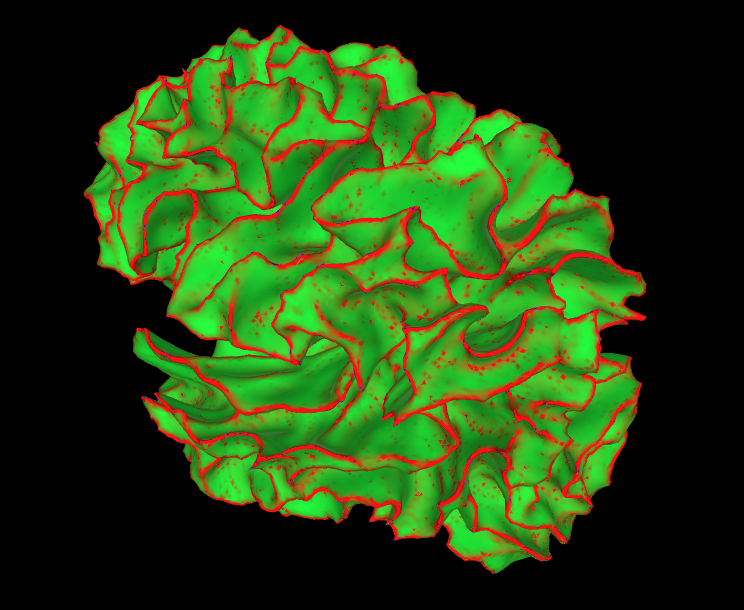
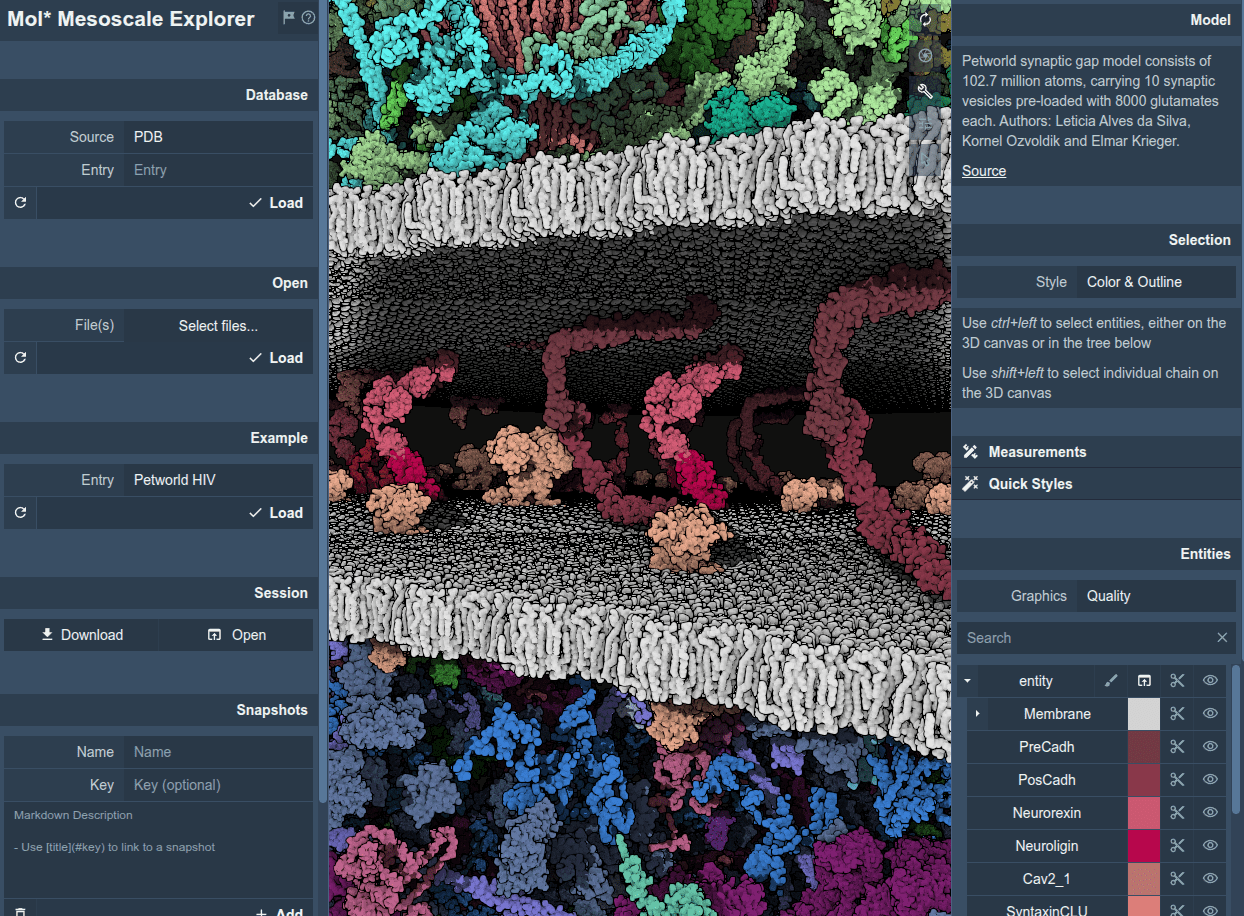
Scientific Visualization
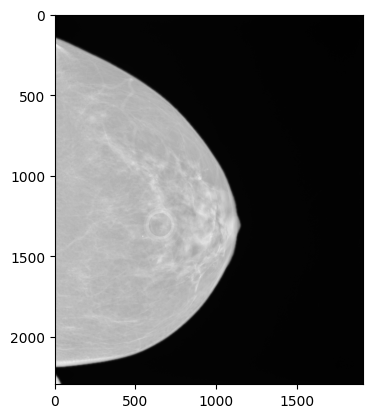
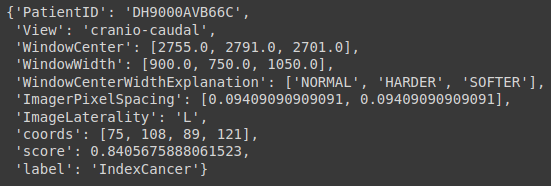
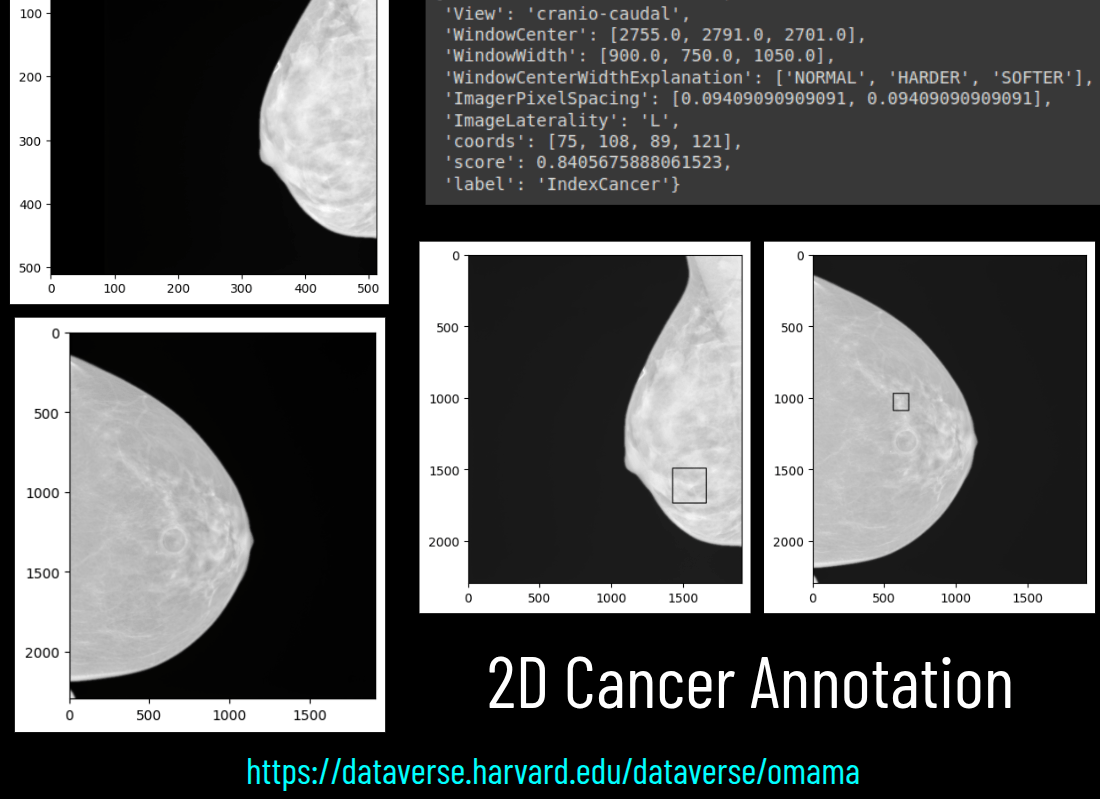
2D Cancer Annotation
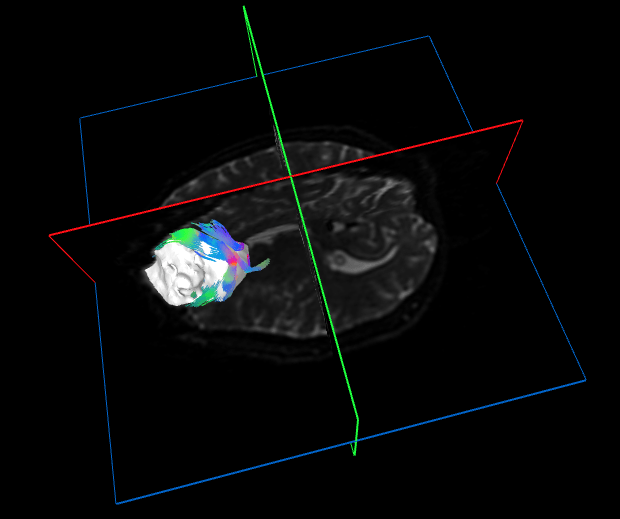
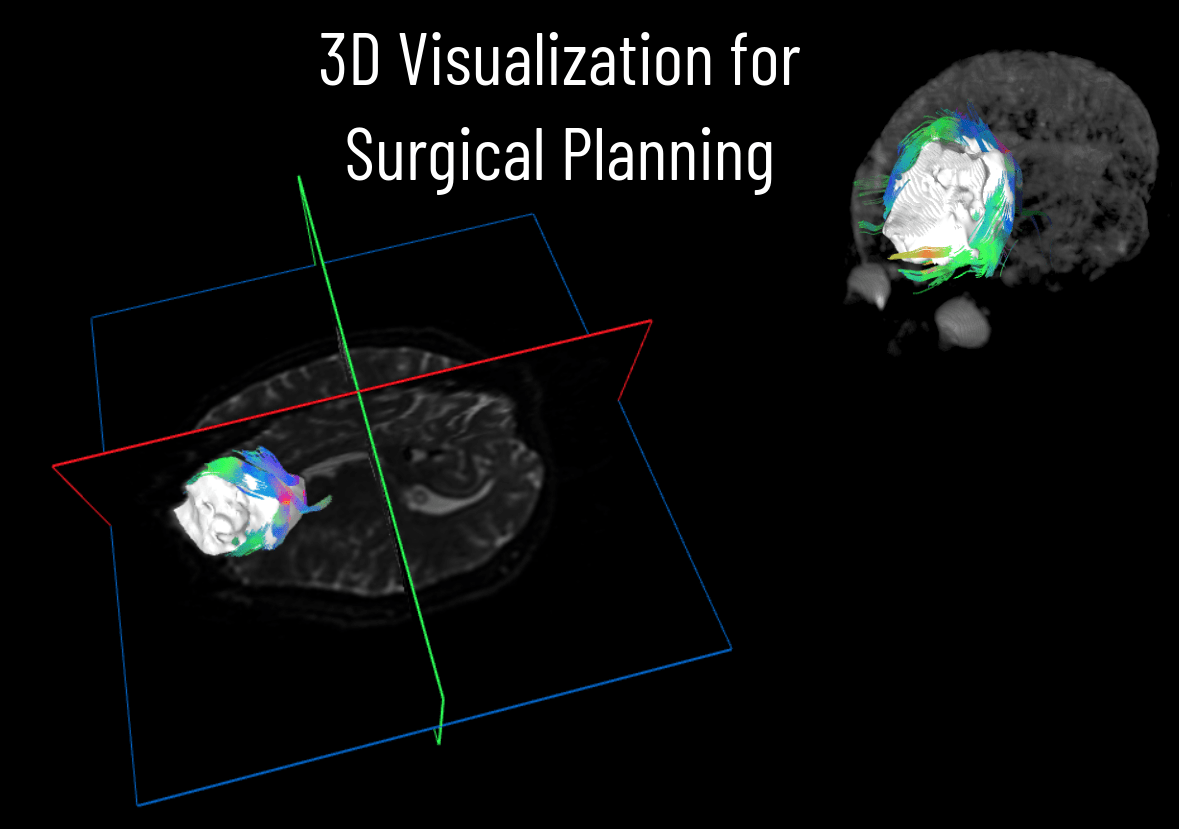
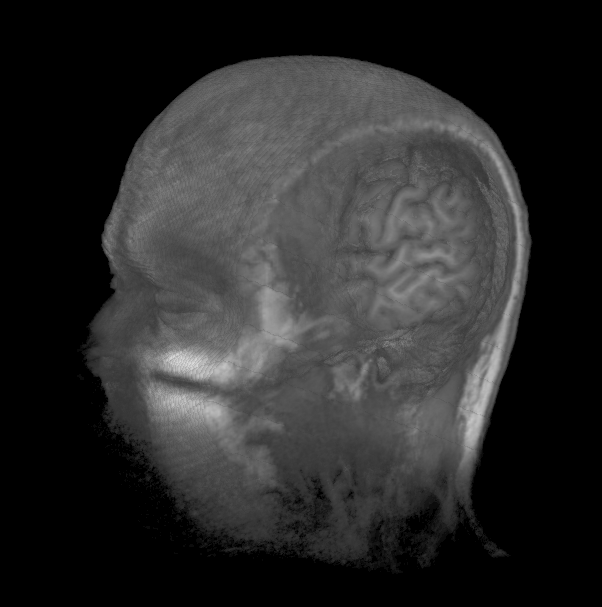
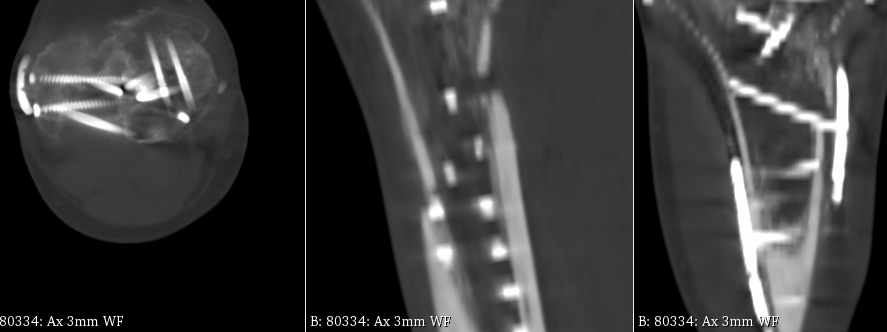
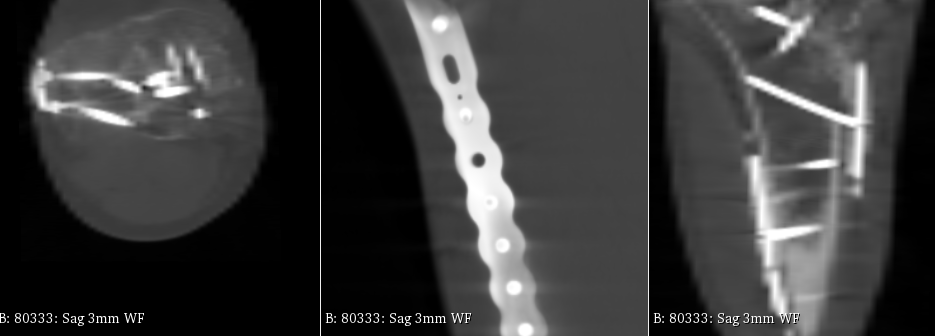
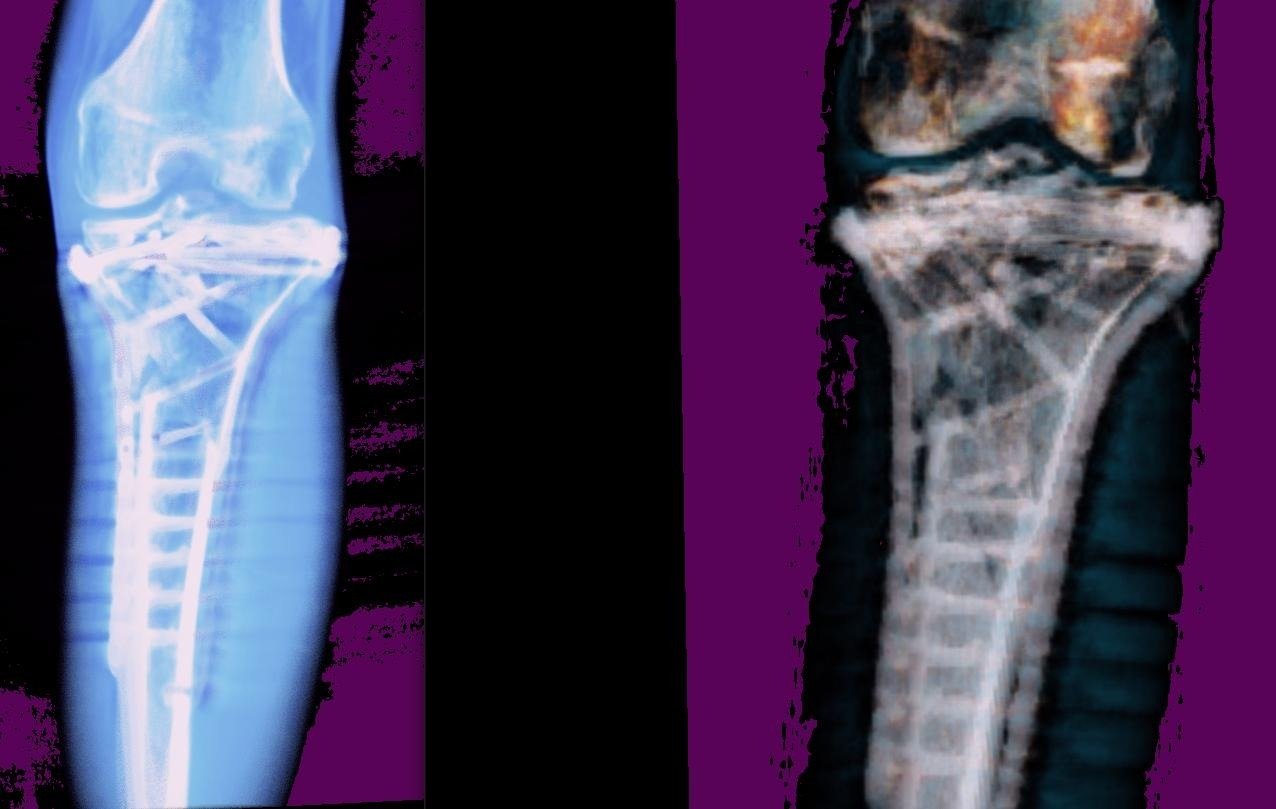
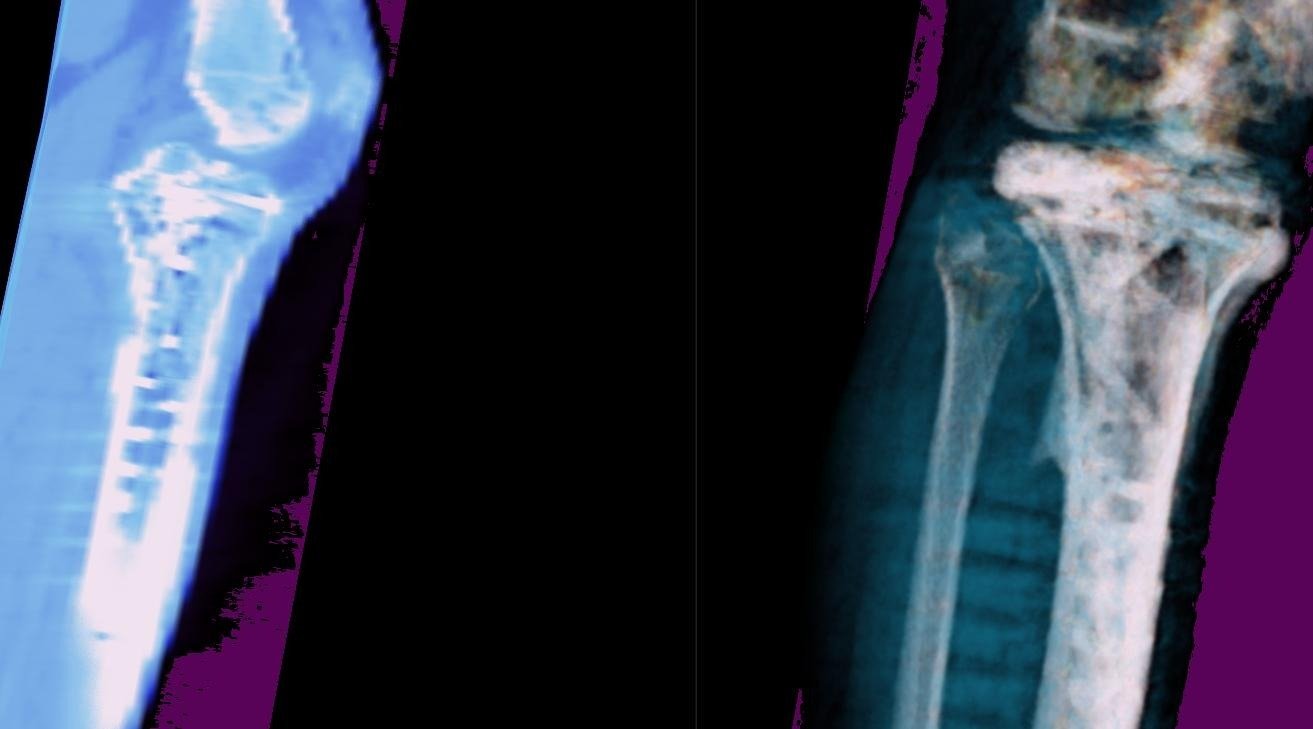
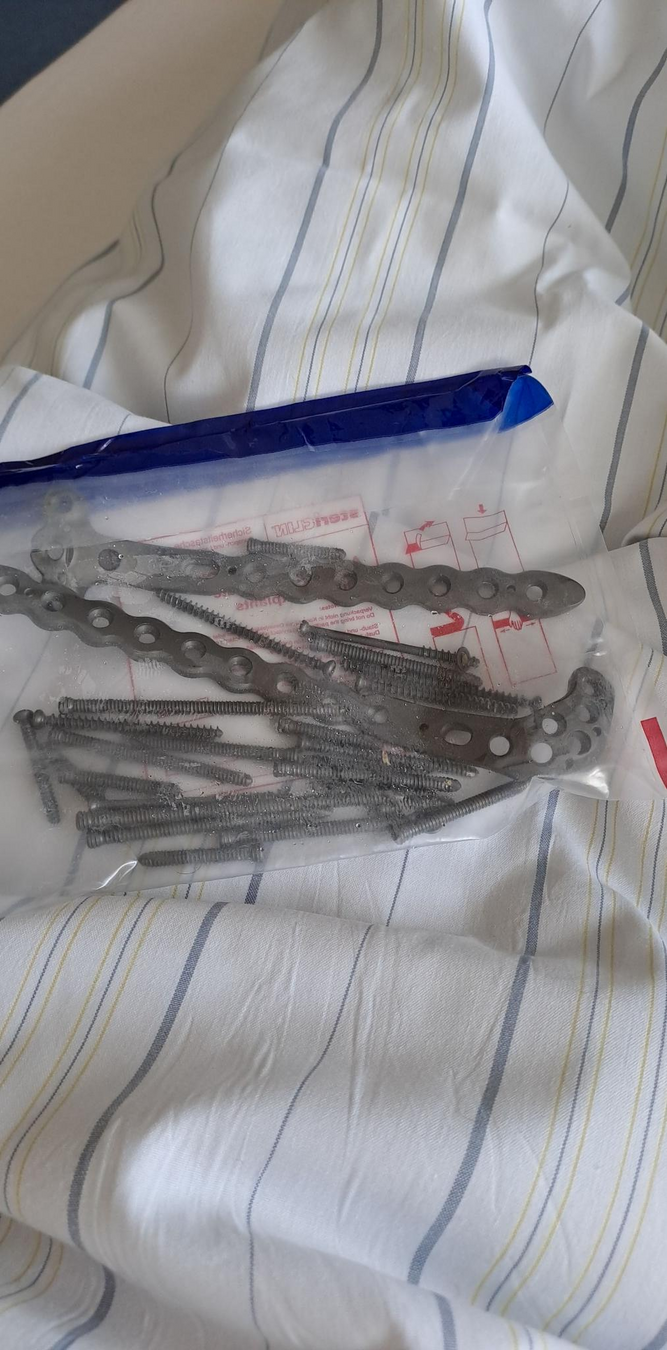
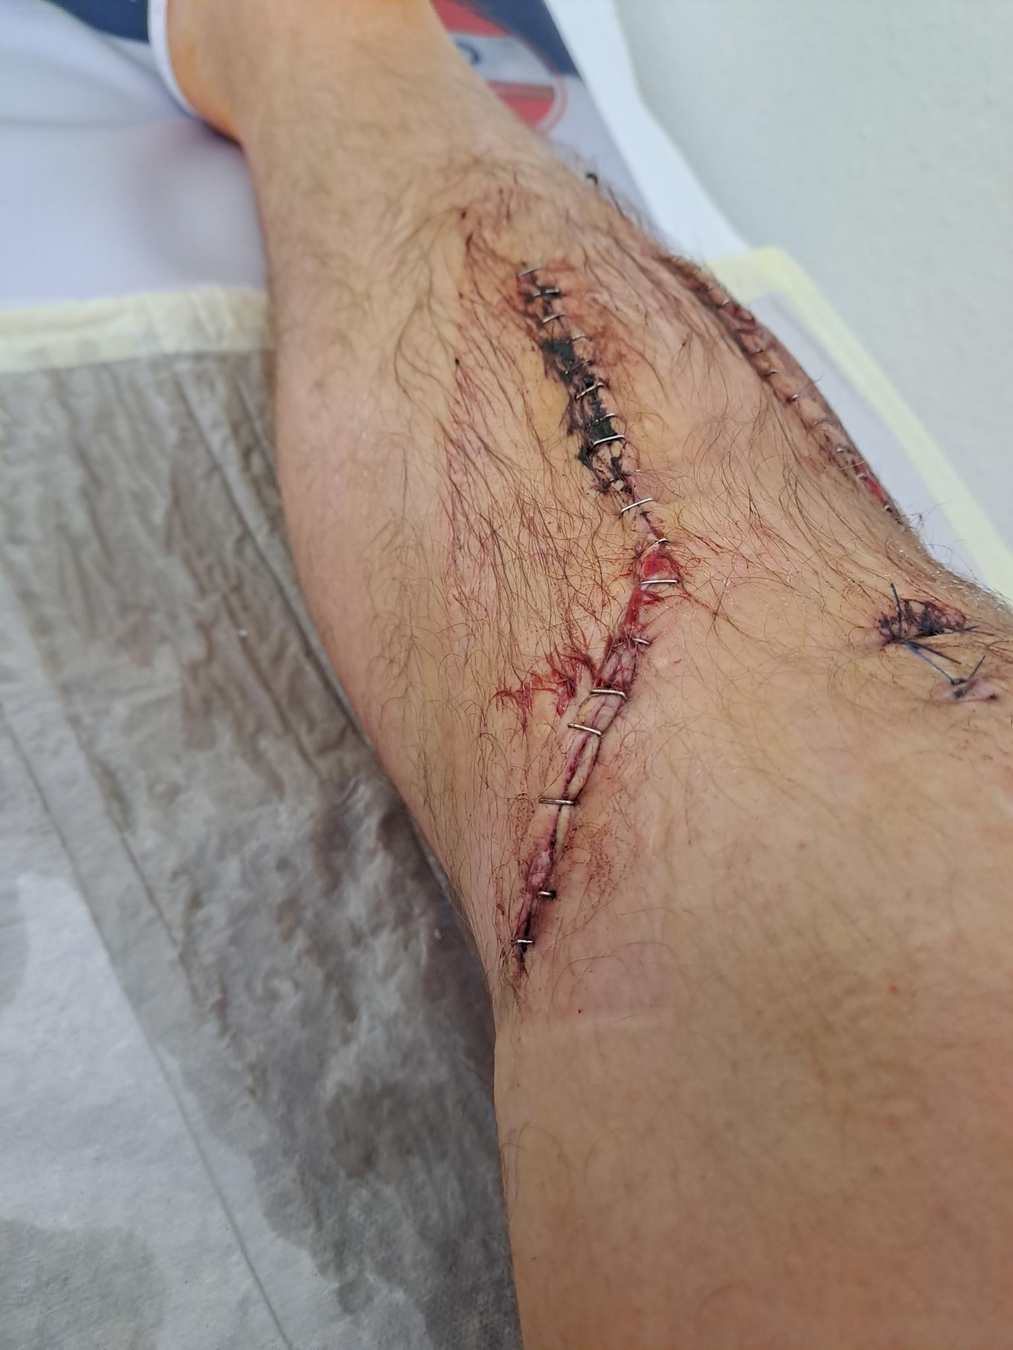
3D Visualization for Surgical Planning
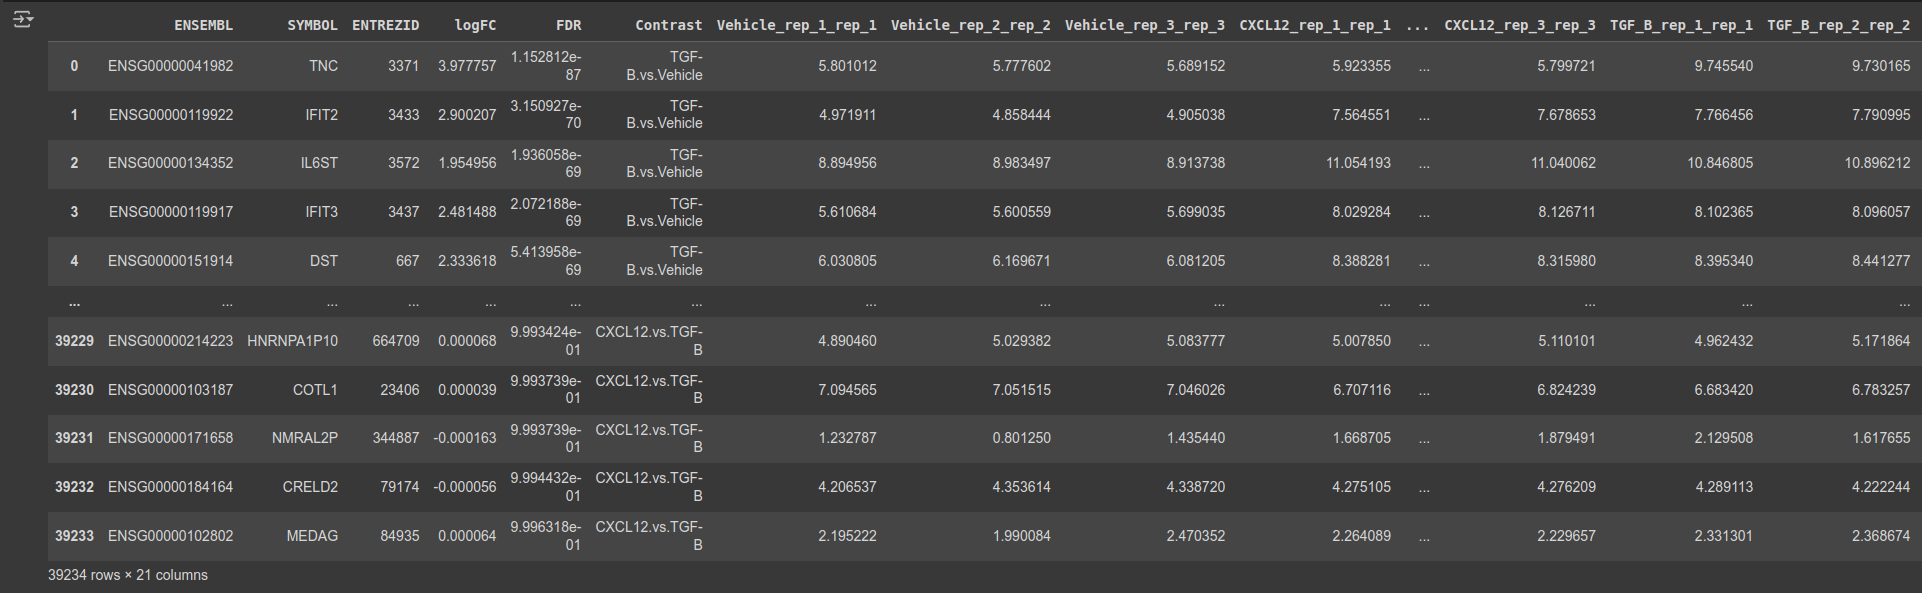
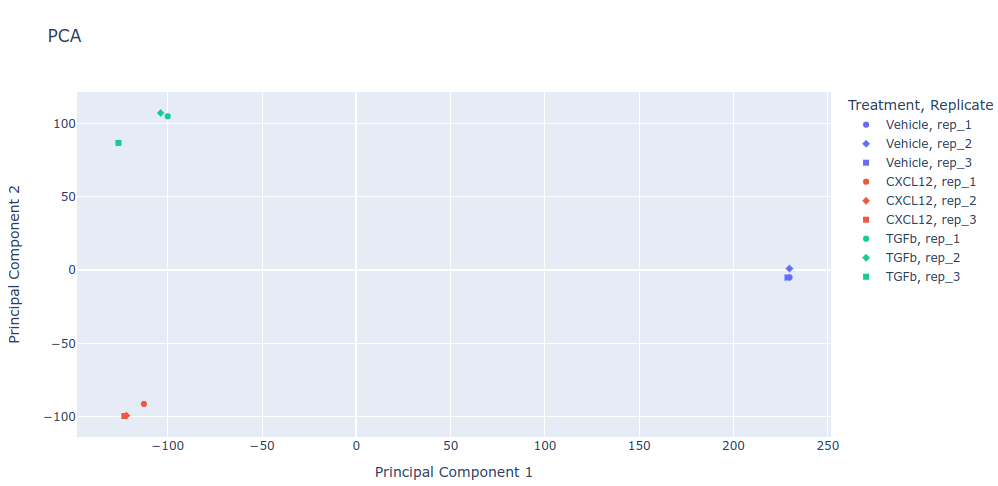
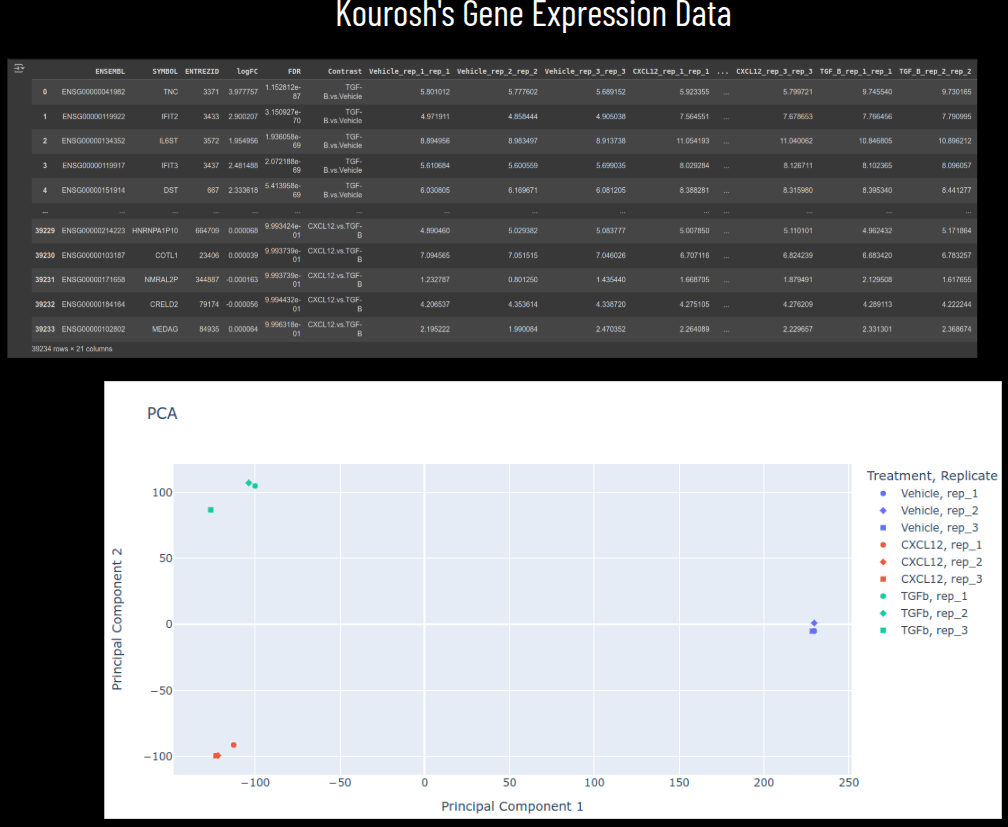
Kourosh's Gene Expression Data
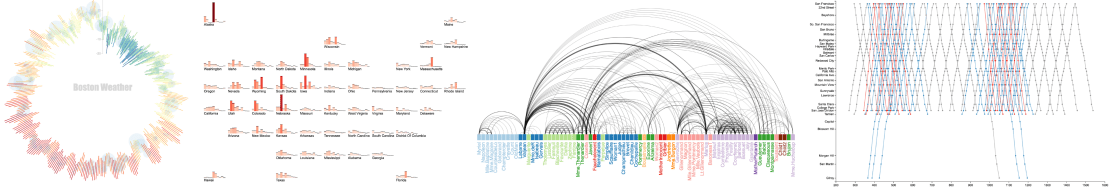
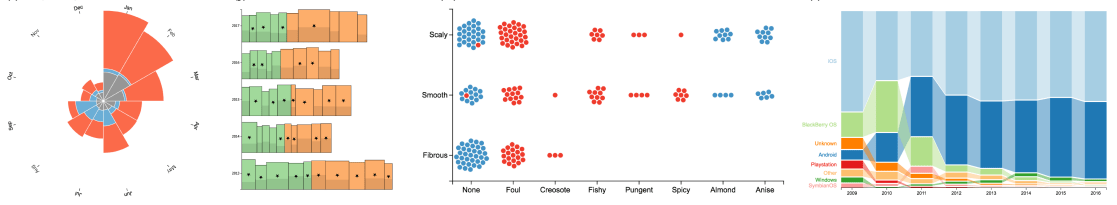
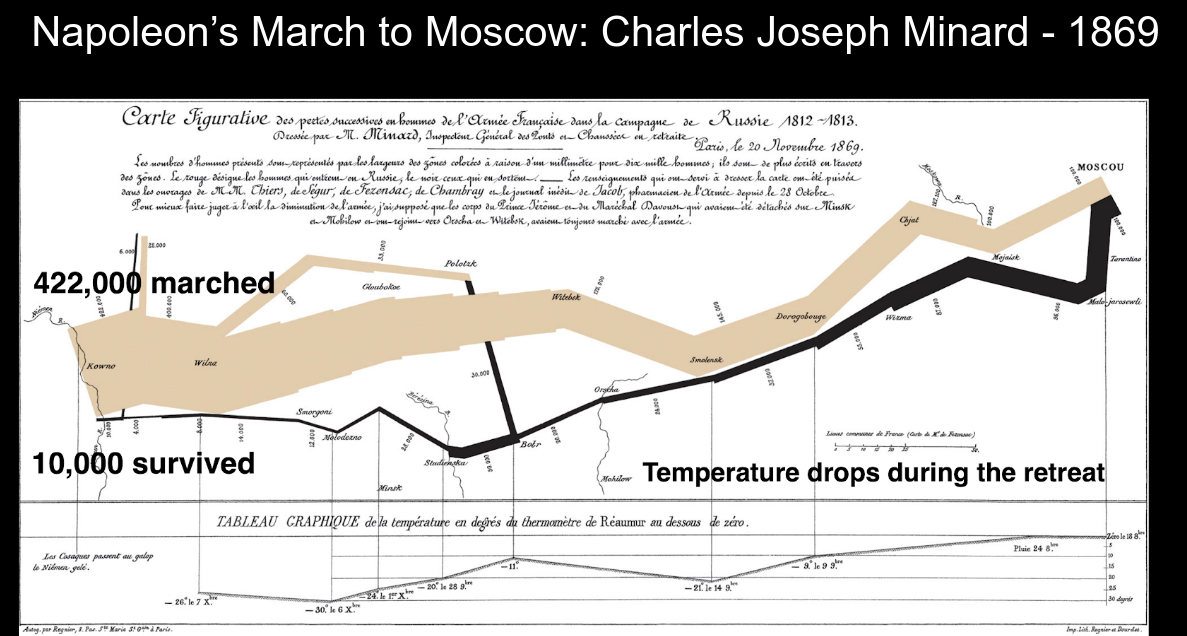
Information Visualization
Data Visualization
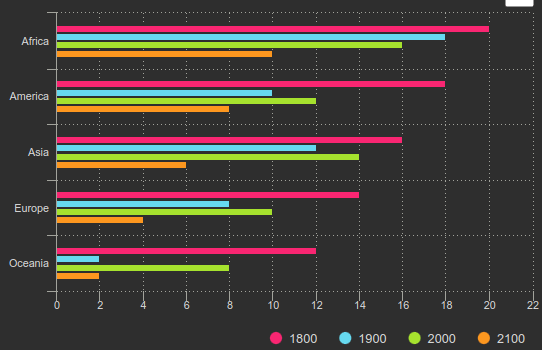
Scientific Visualization == black background
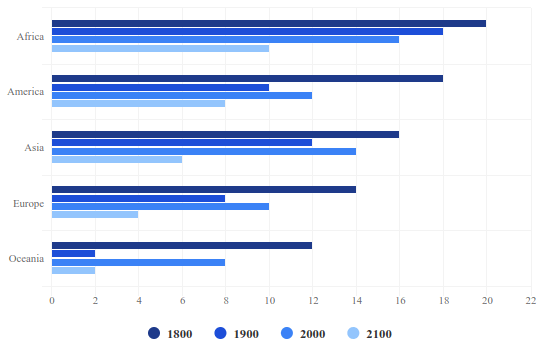
Information Visualization == white background
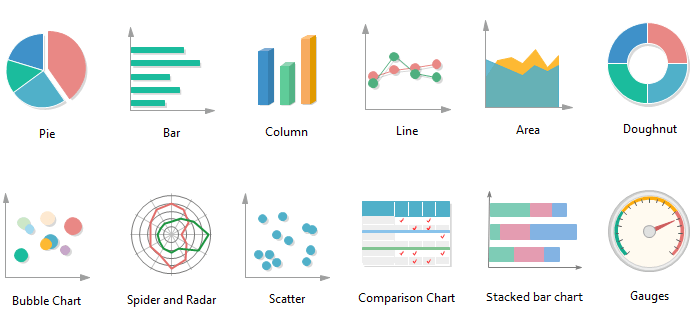
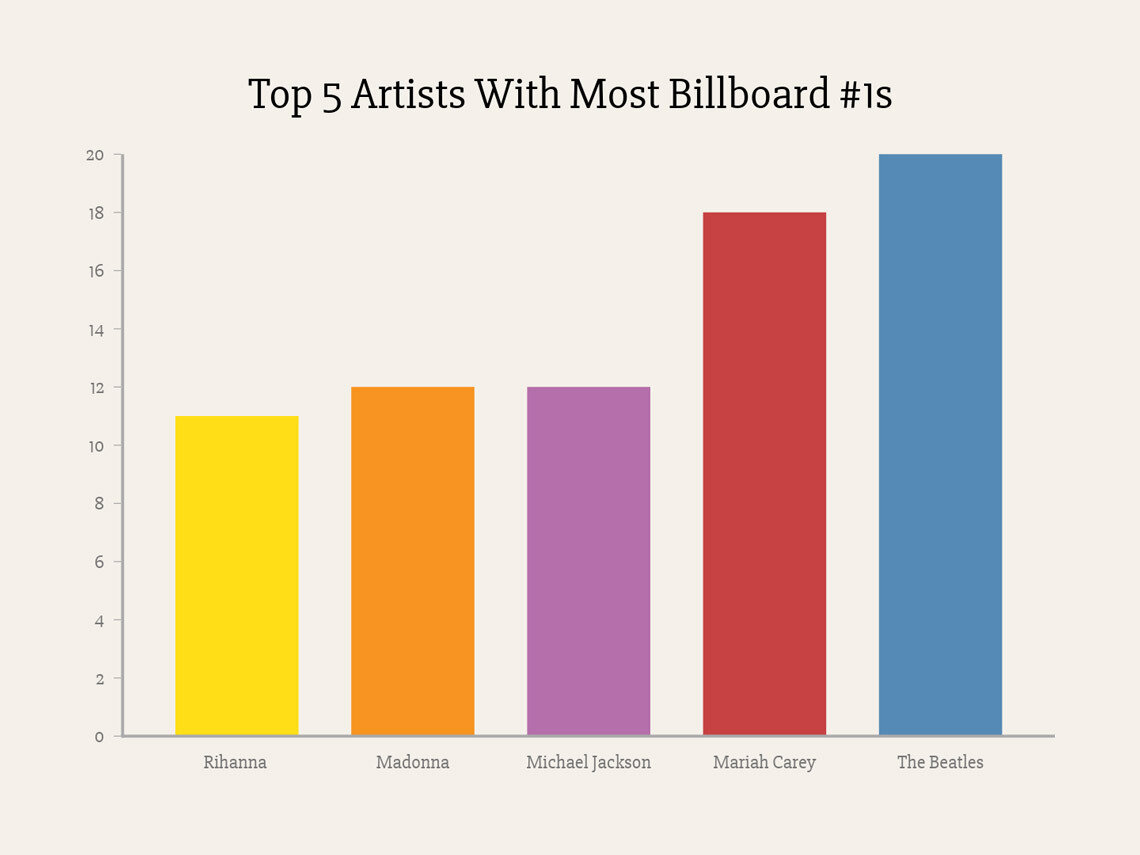
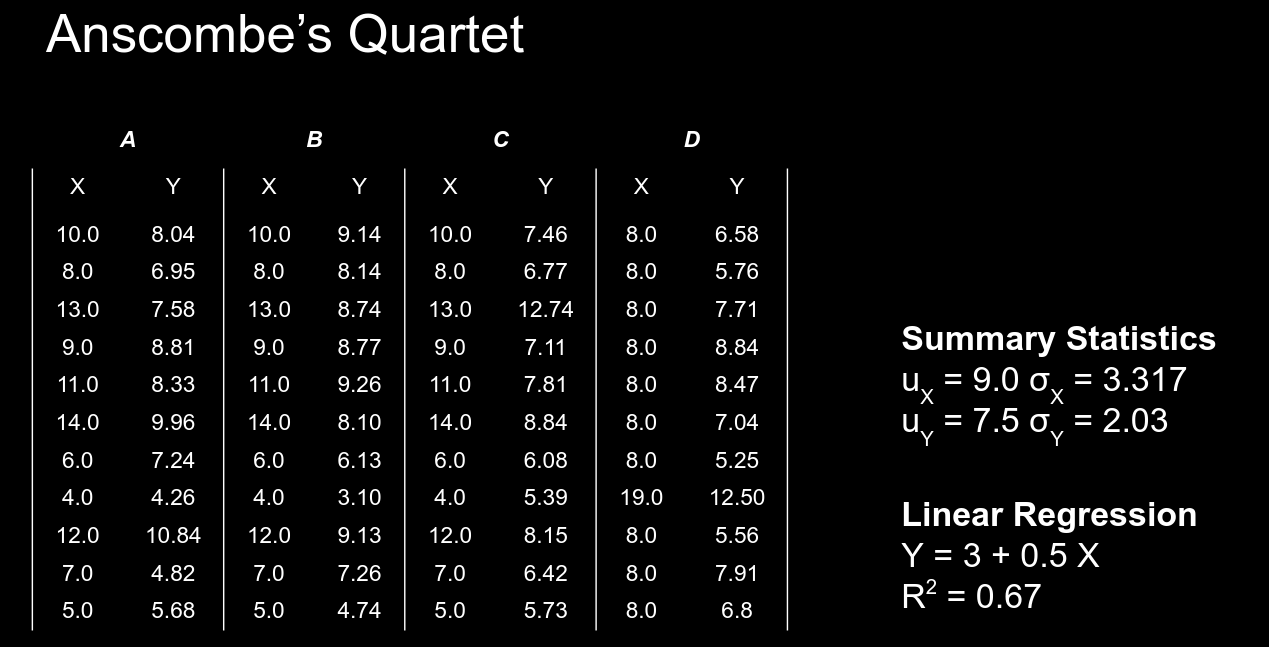
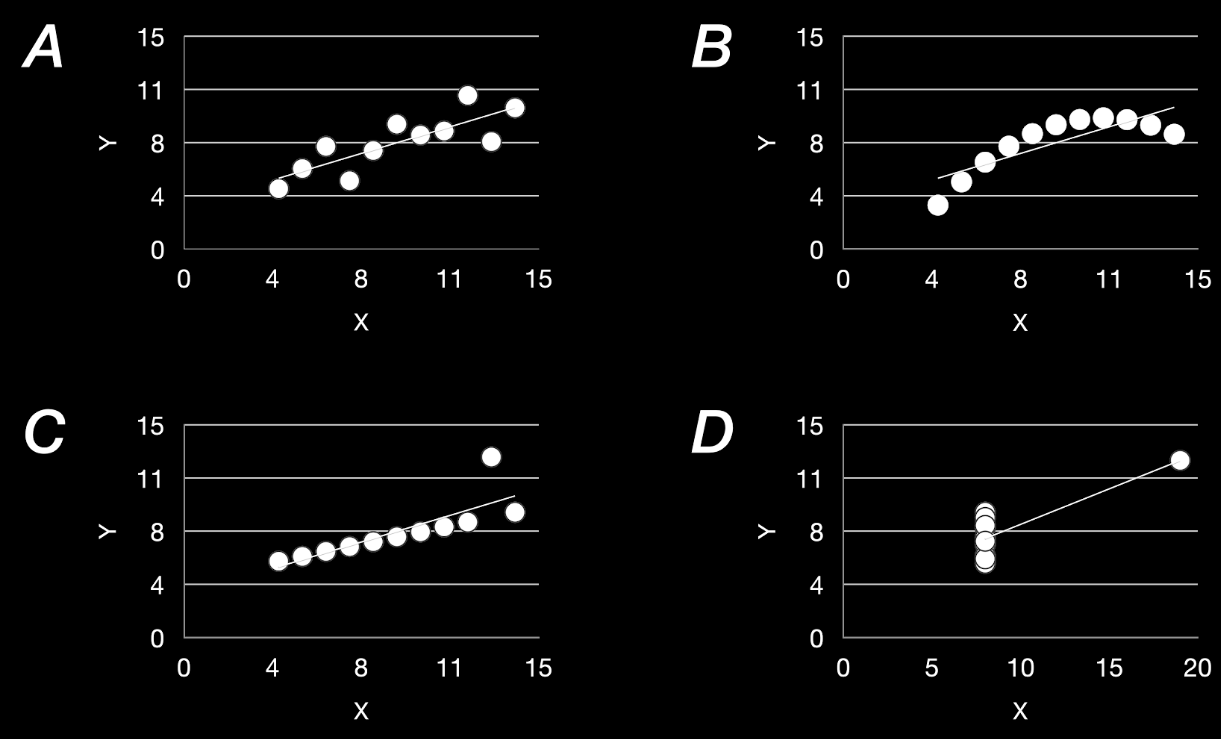
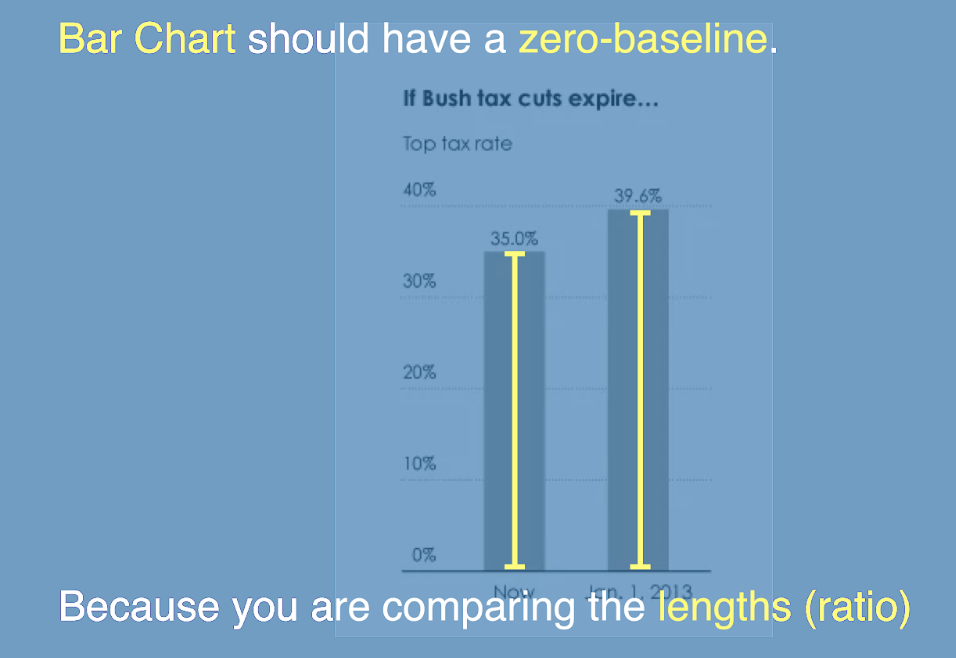
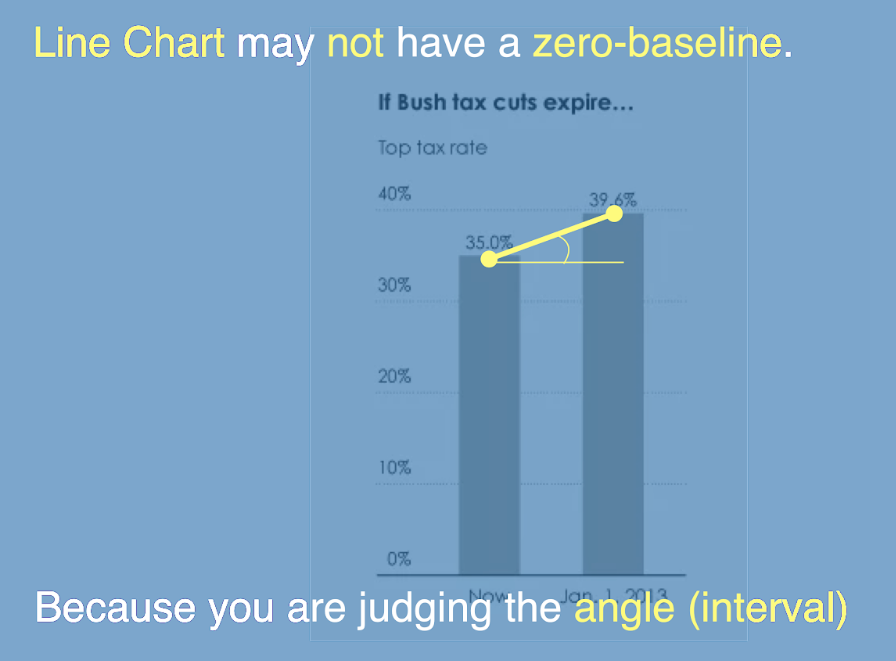
Charts
as building blocks
Information Visualization
Data Visualization
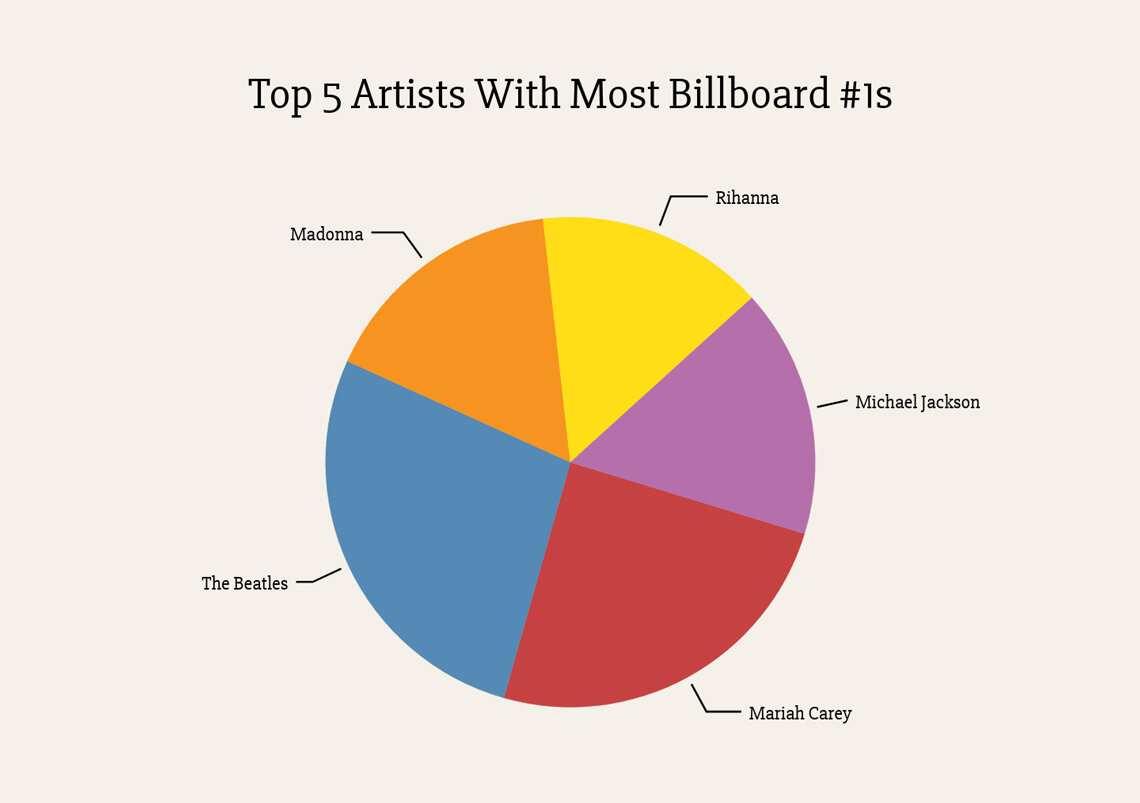
Who has the most #1s?
Who has the least?
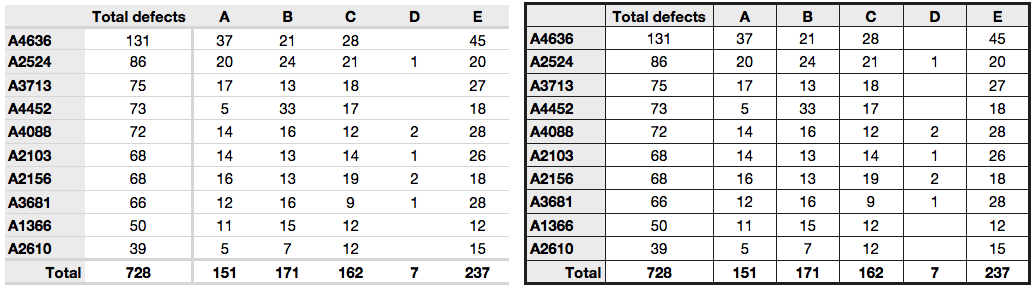
Tables are visualizations too!
this is one is better
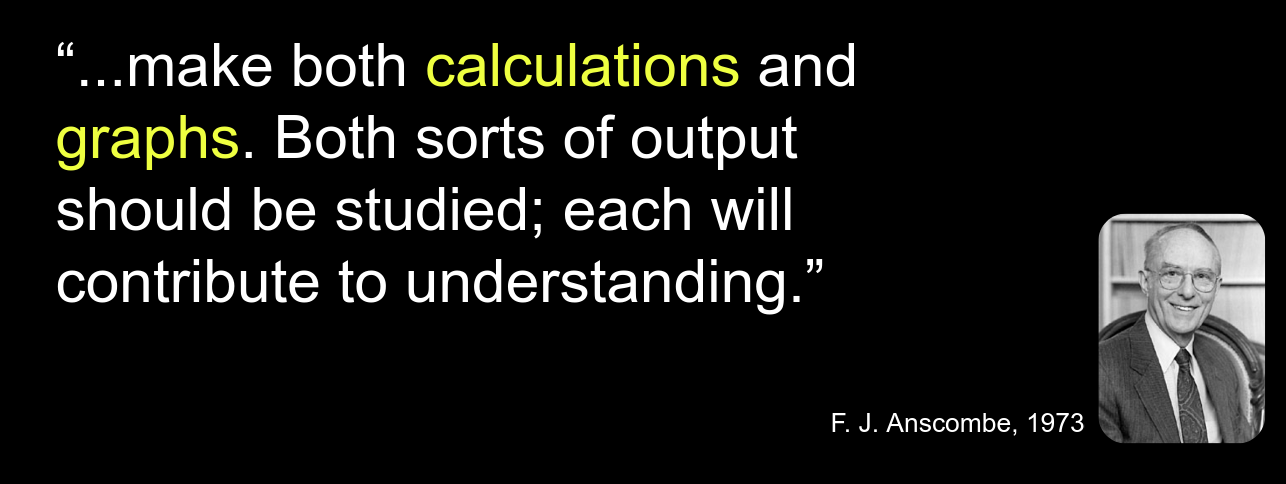
Visualizations should reduce the cognitive load when looking at data!
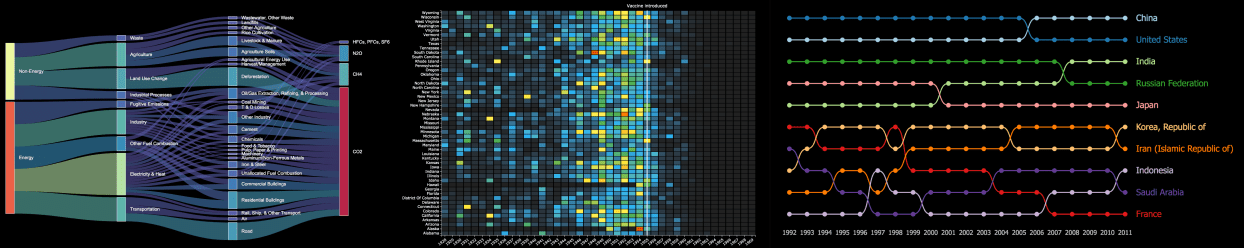
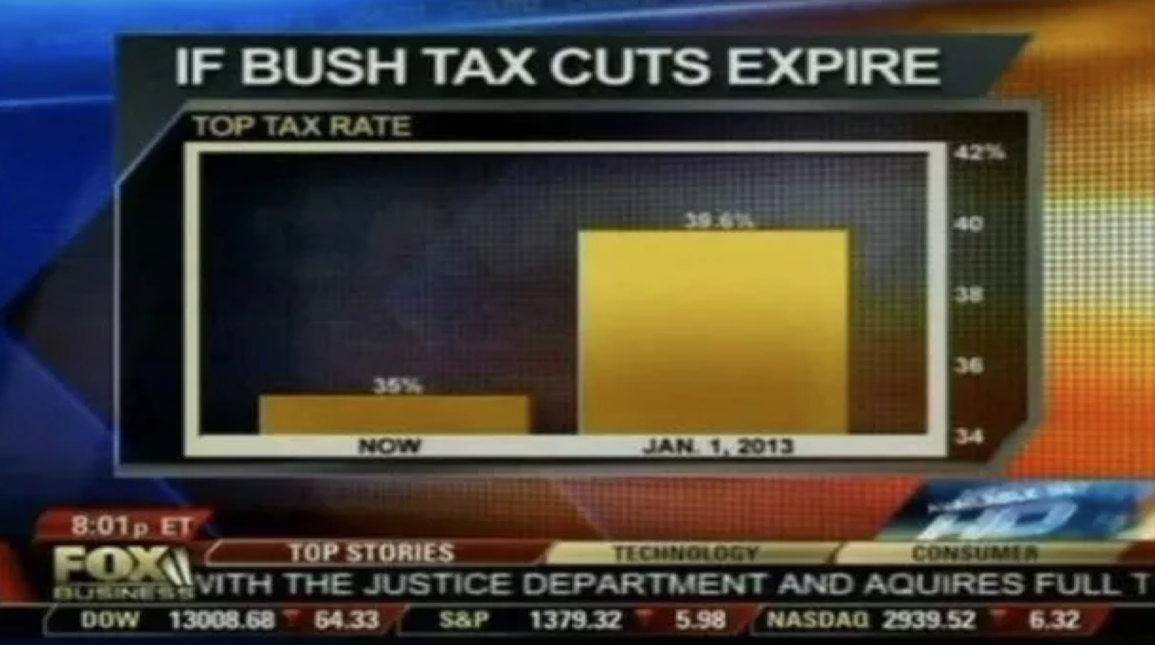
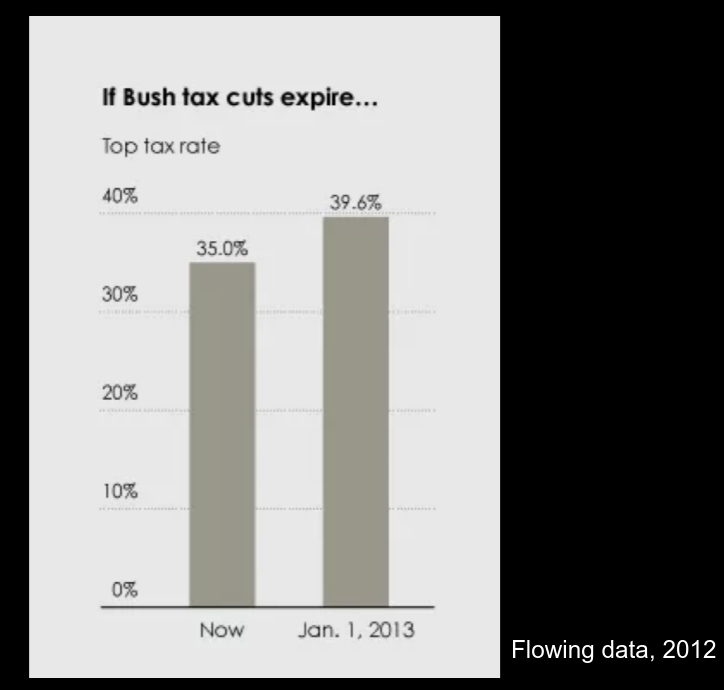
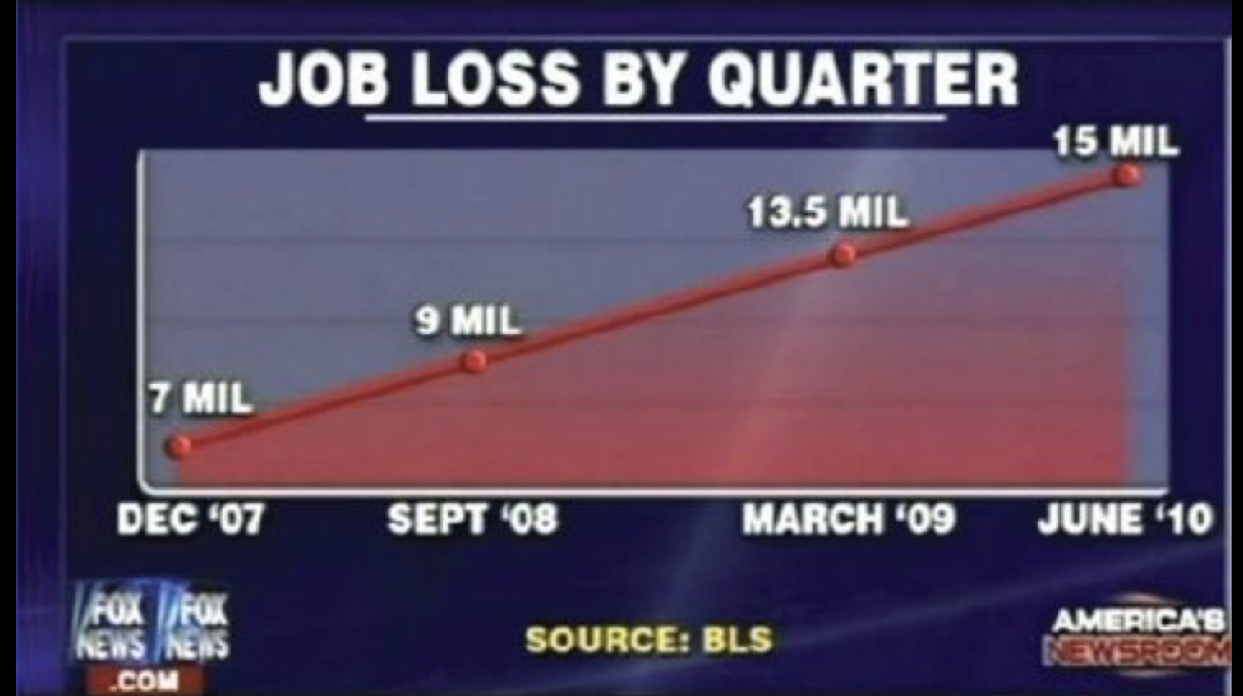
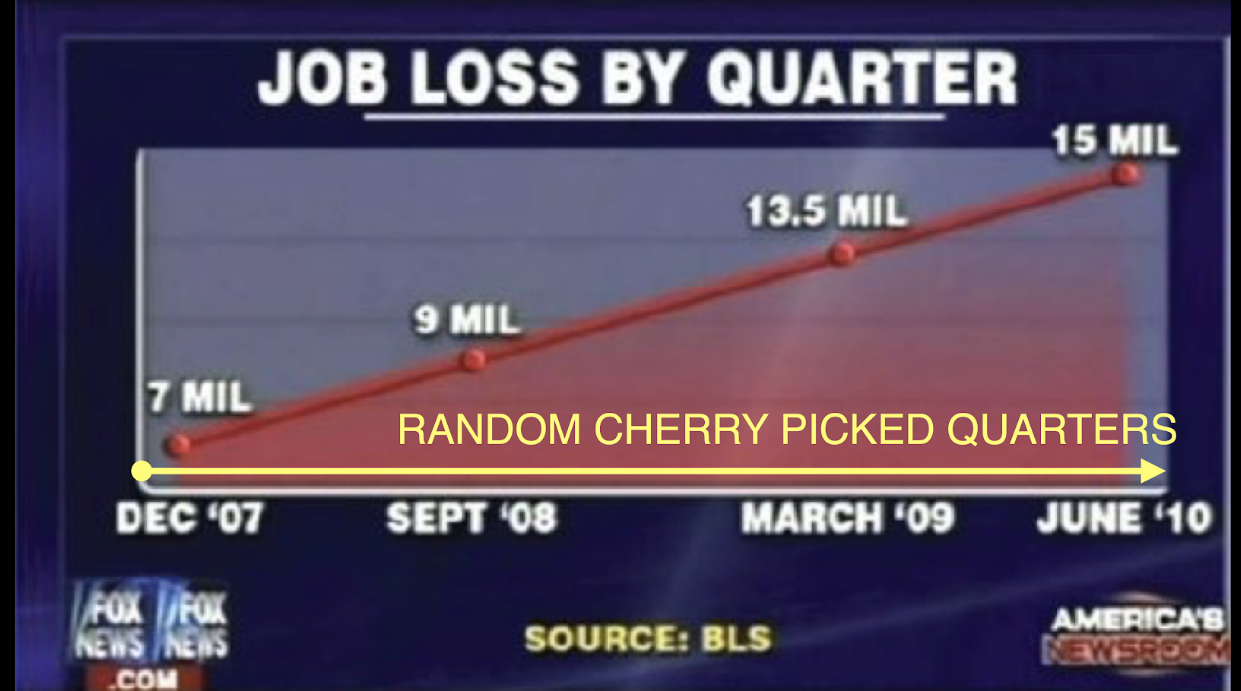
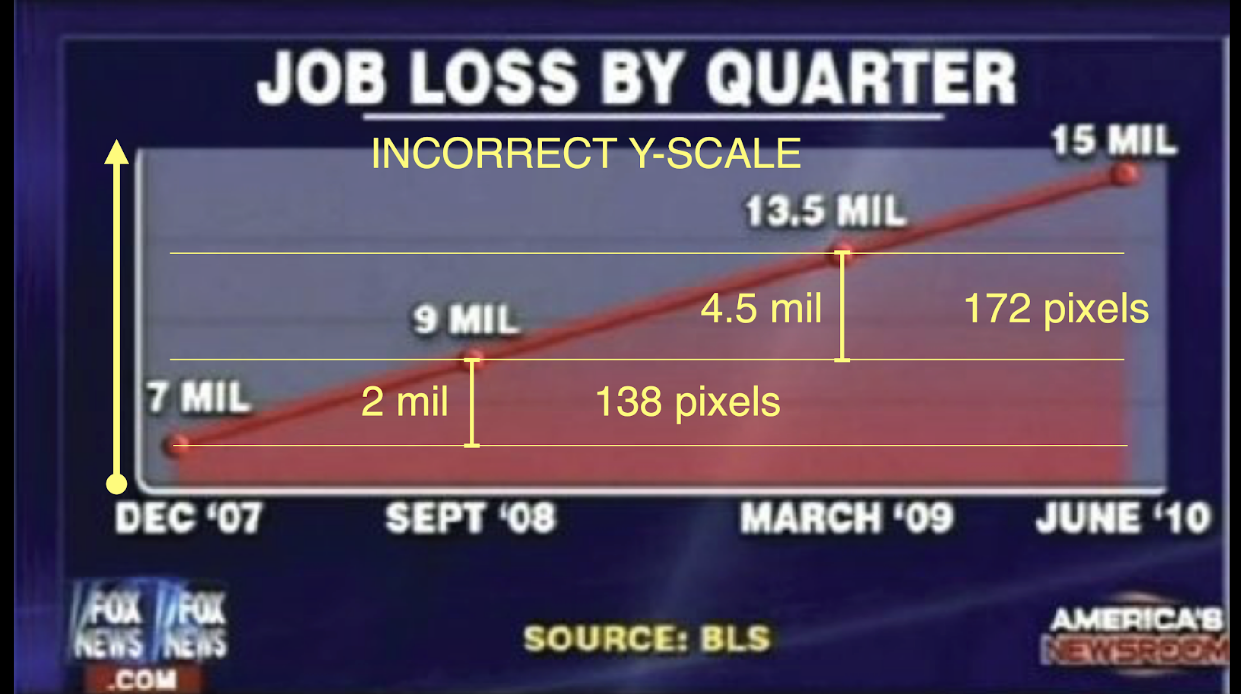
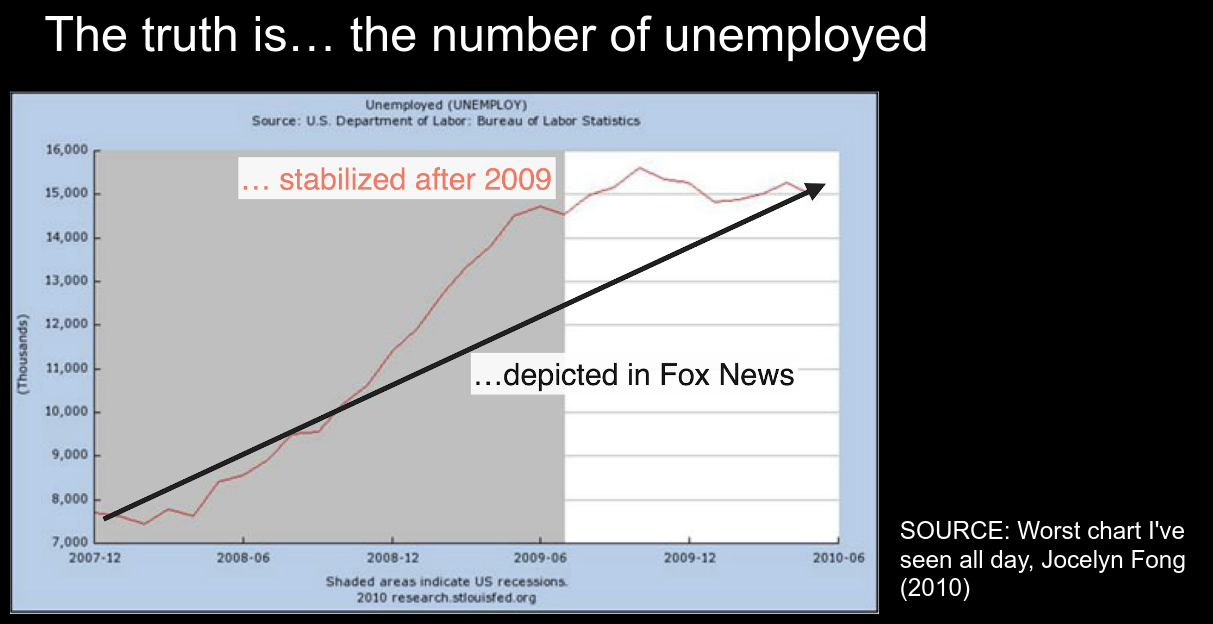
Bad Examples
Information Visualization
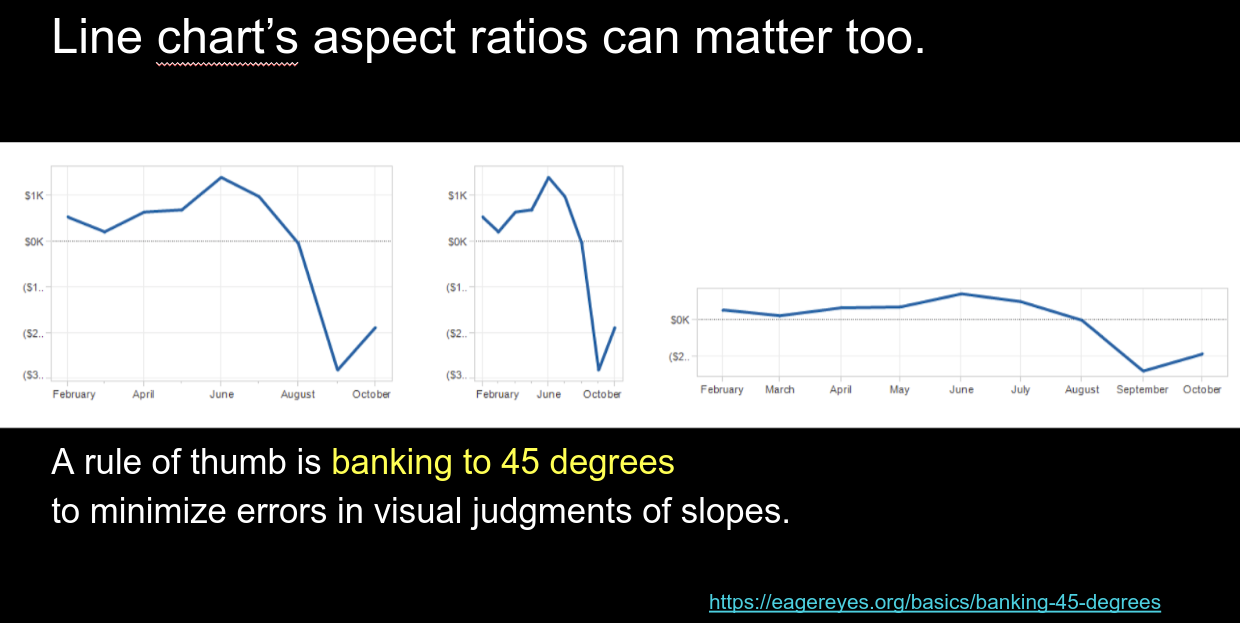
Line Chart Aspect Ratio
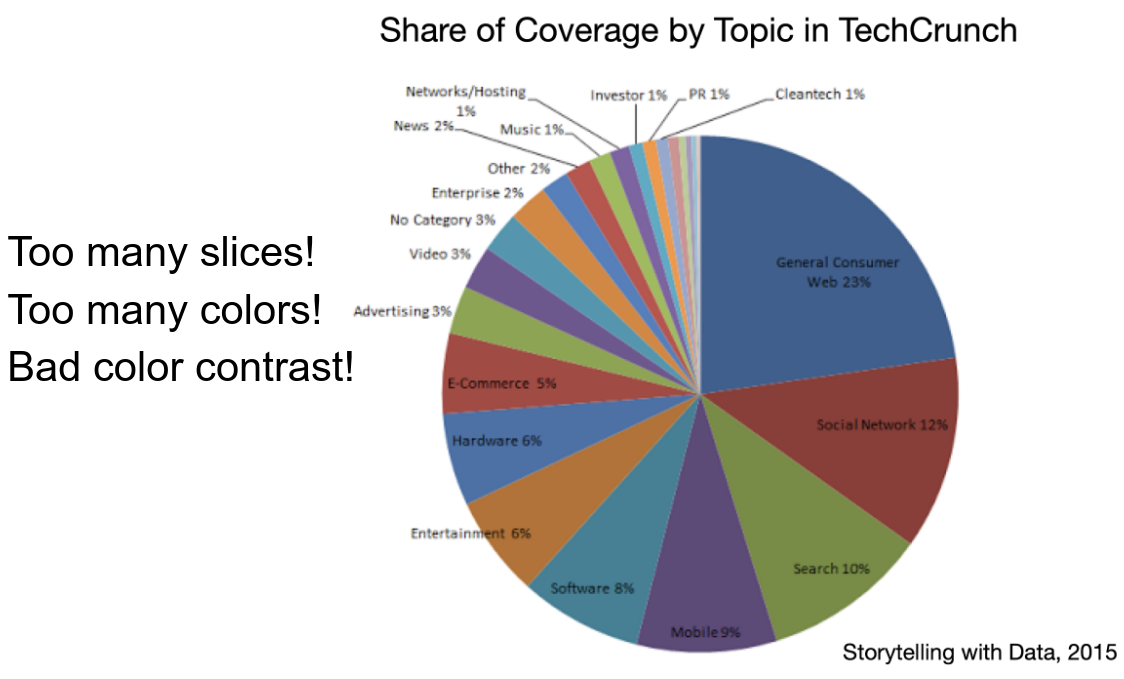
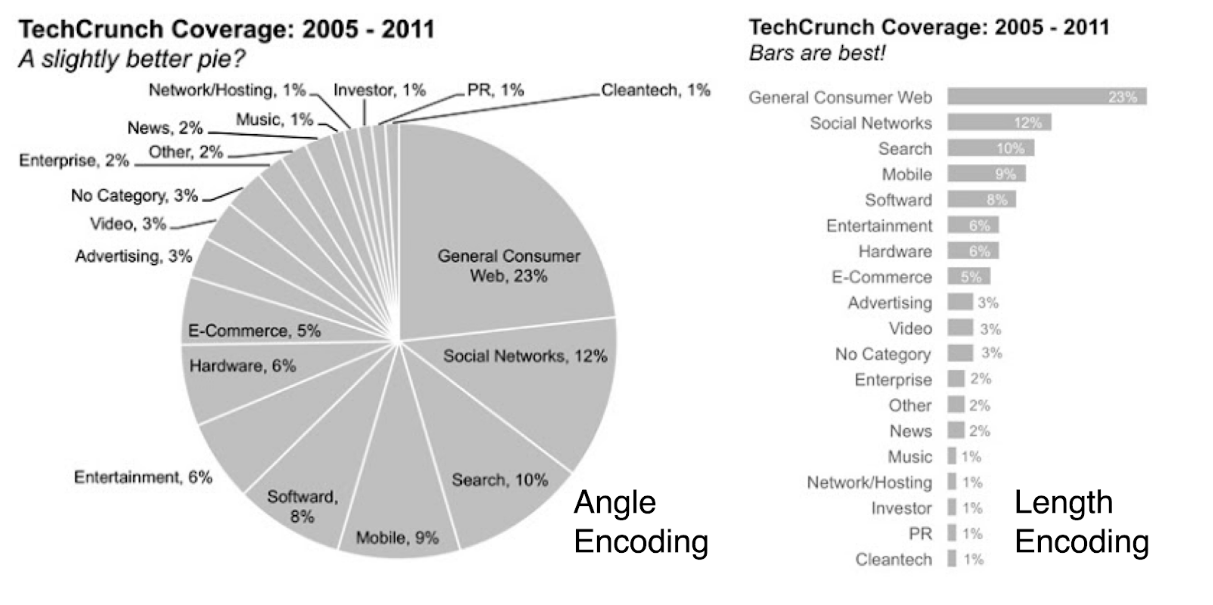
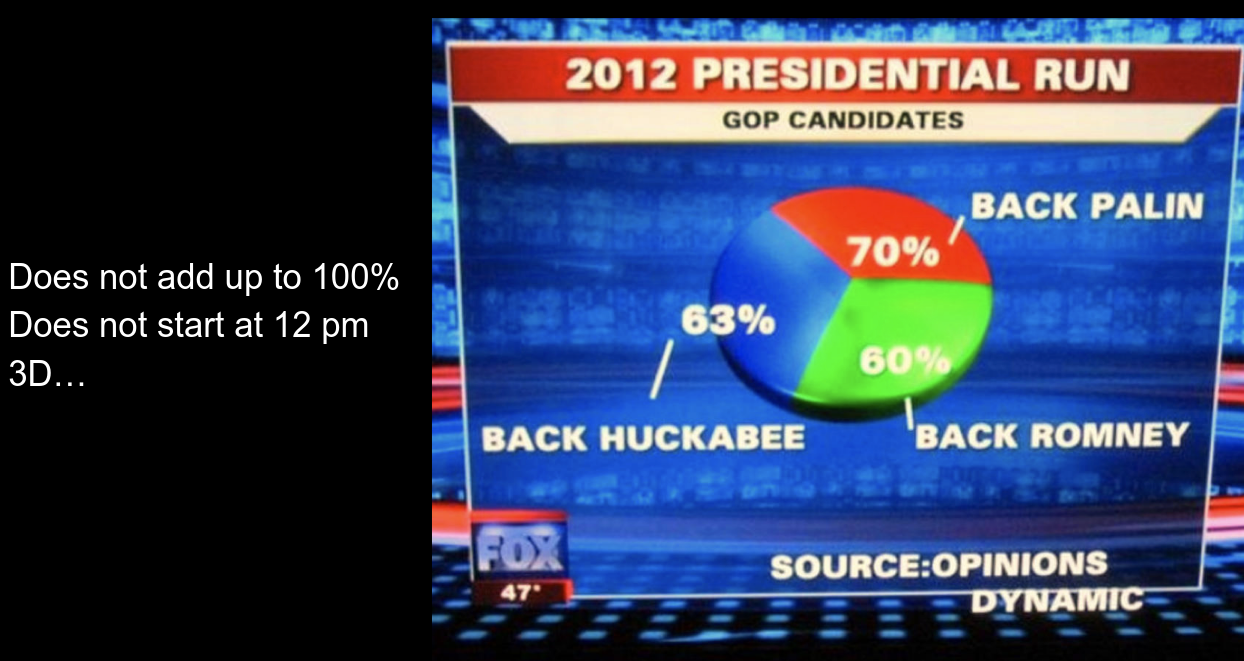
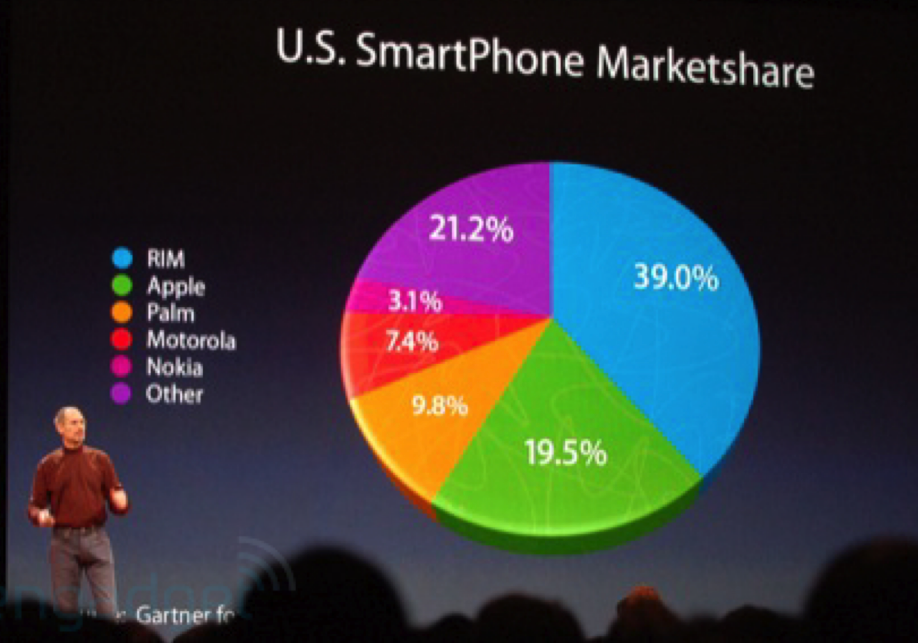
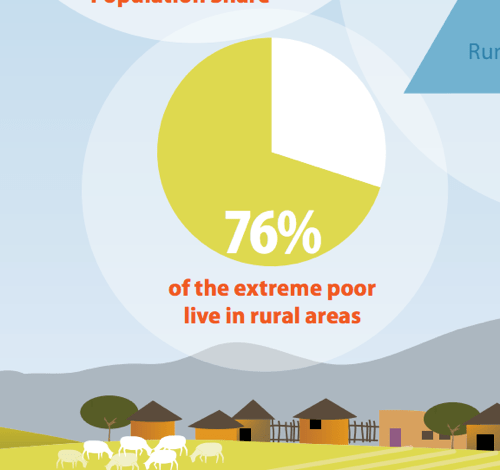
Pie Charts
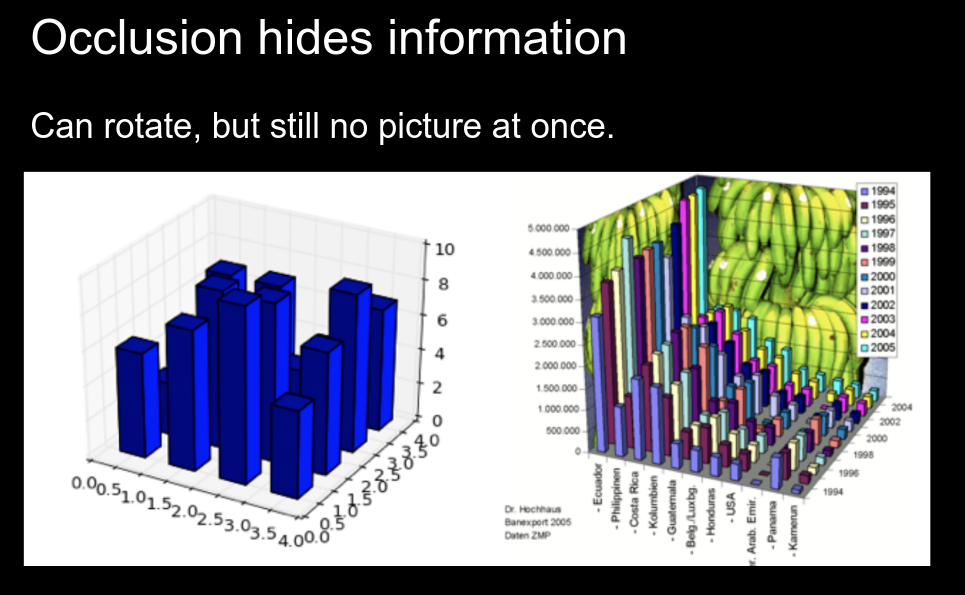
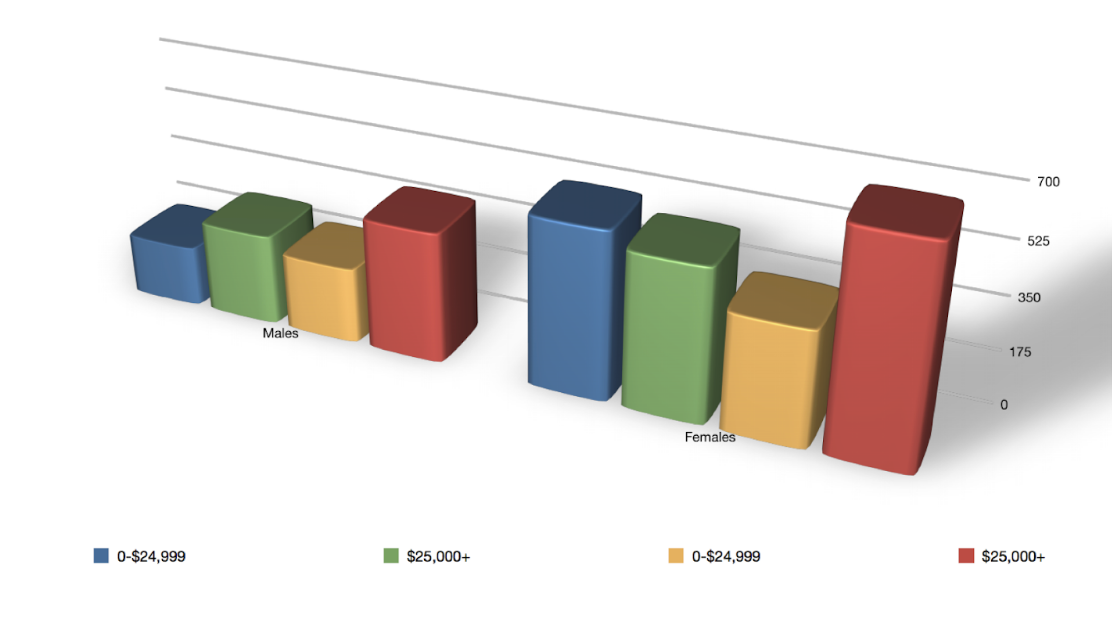
3D plots can lead to occlusion and confusion
and these are ugly colors!!
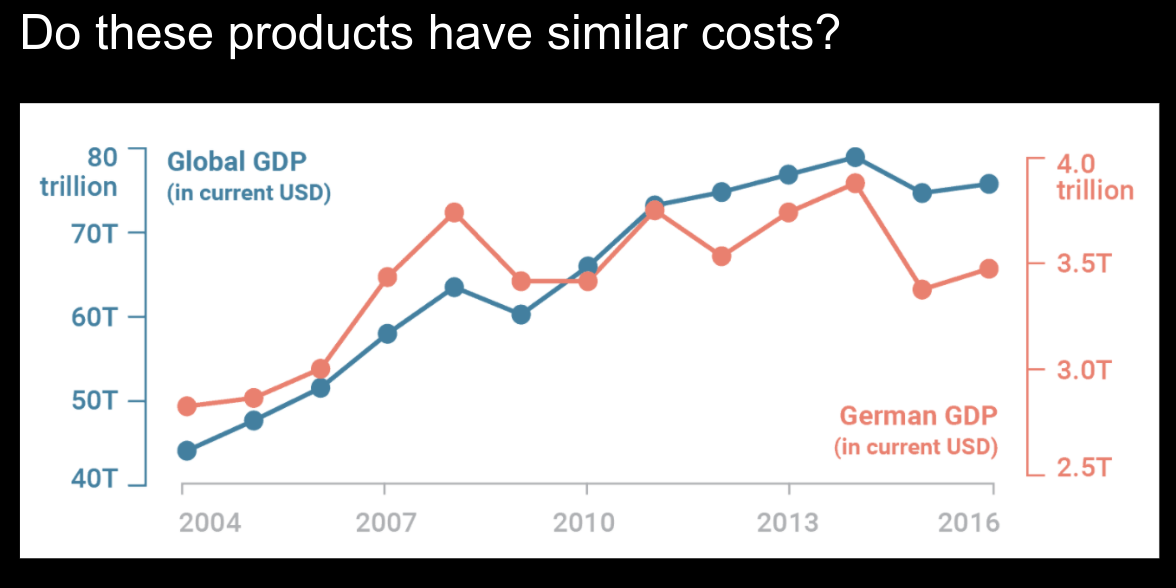
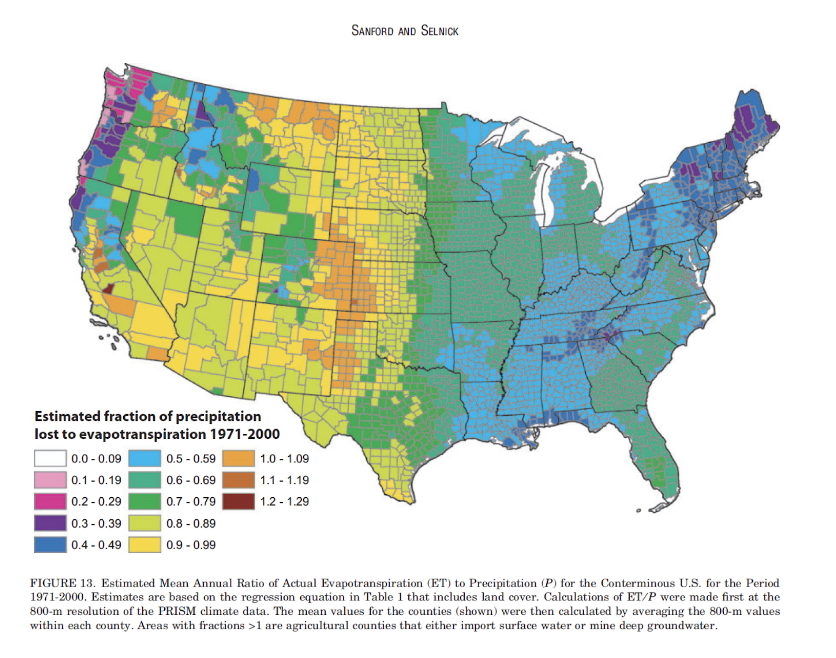
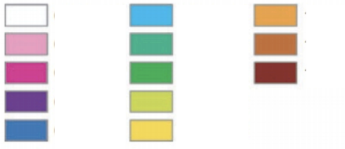
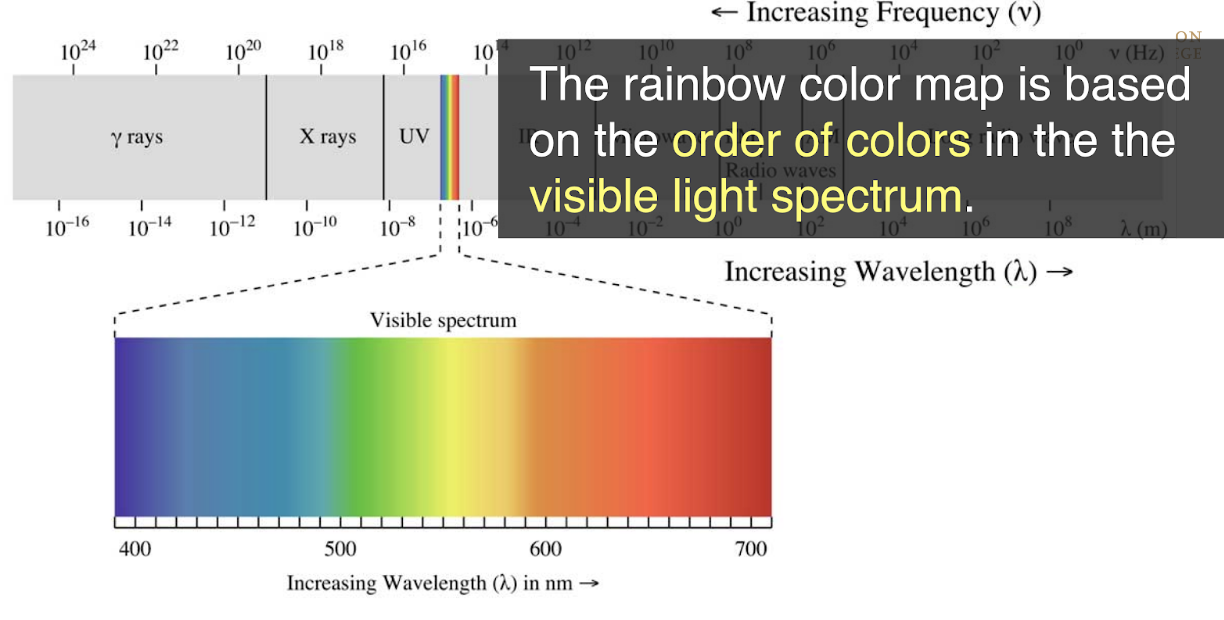
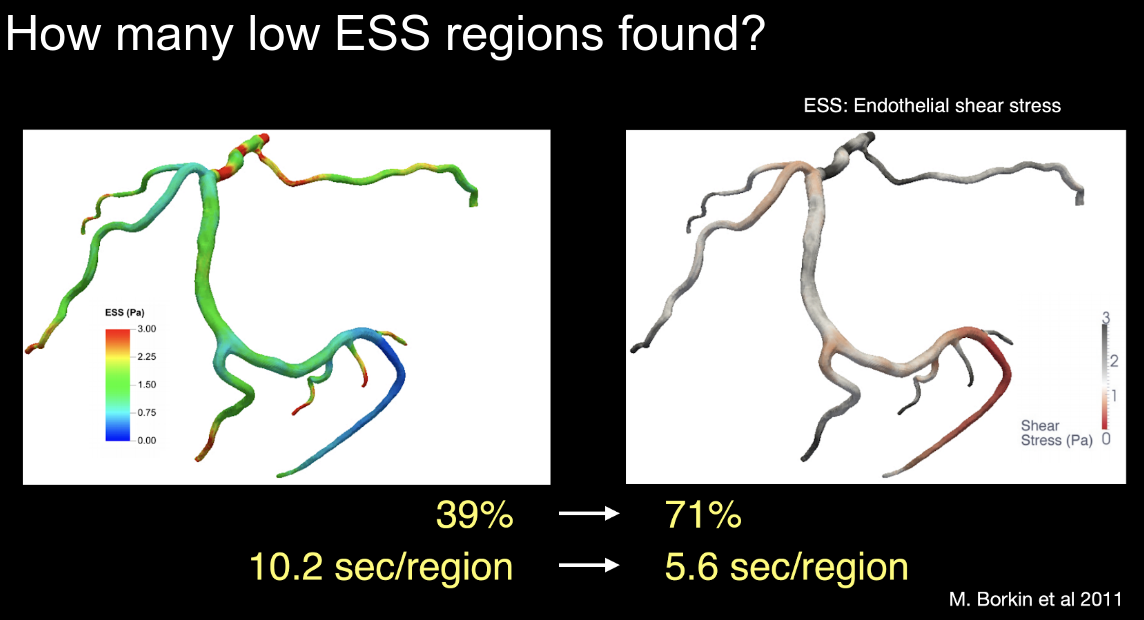
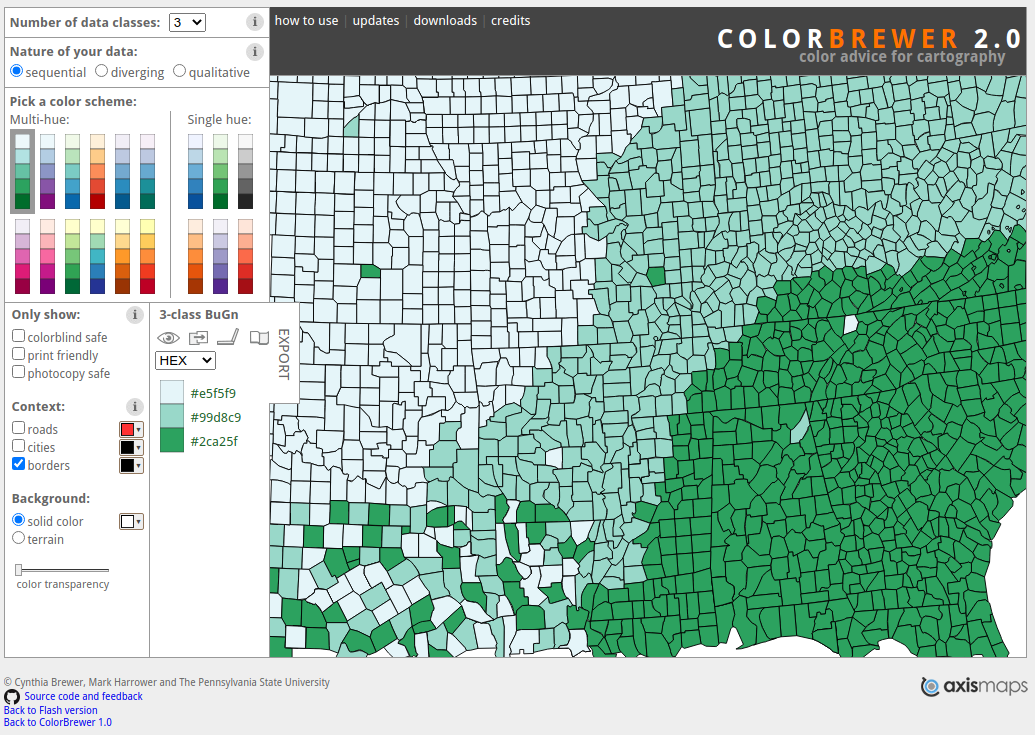
Colors!
Can you tell which color represents higher or lower values?
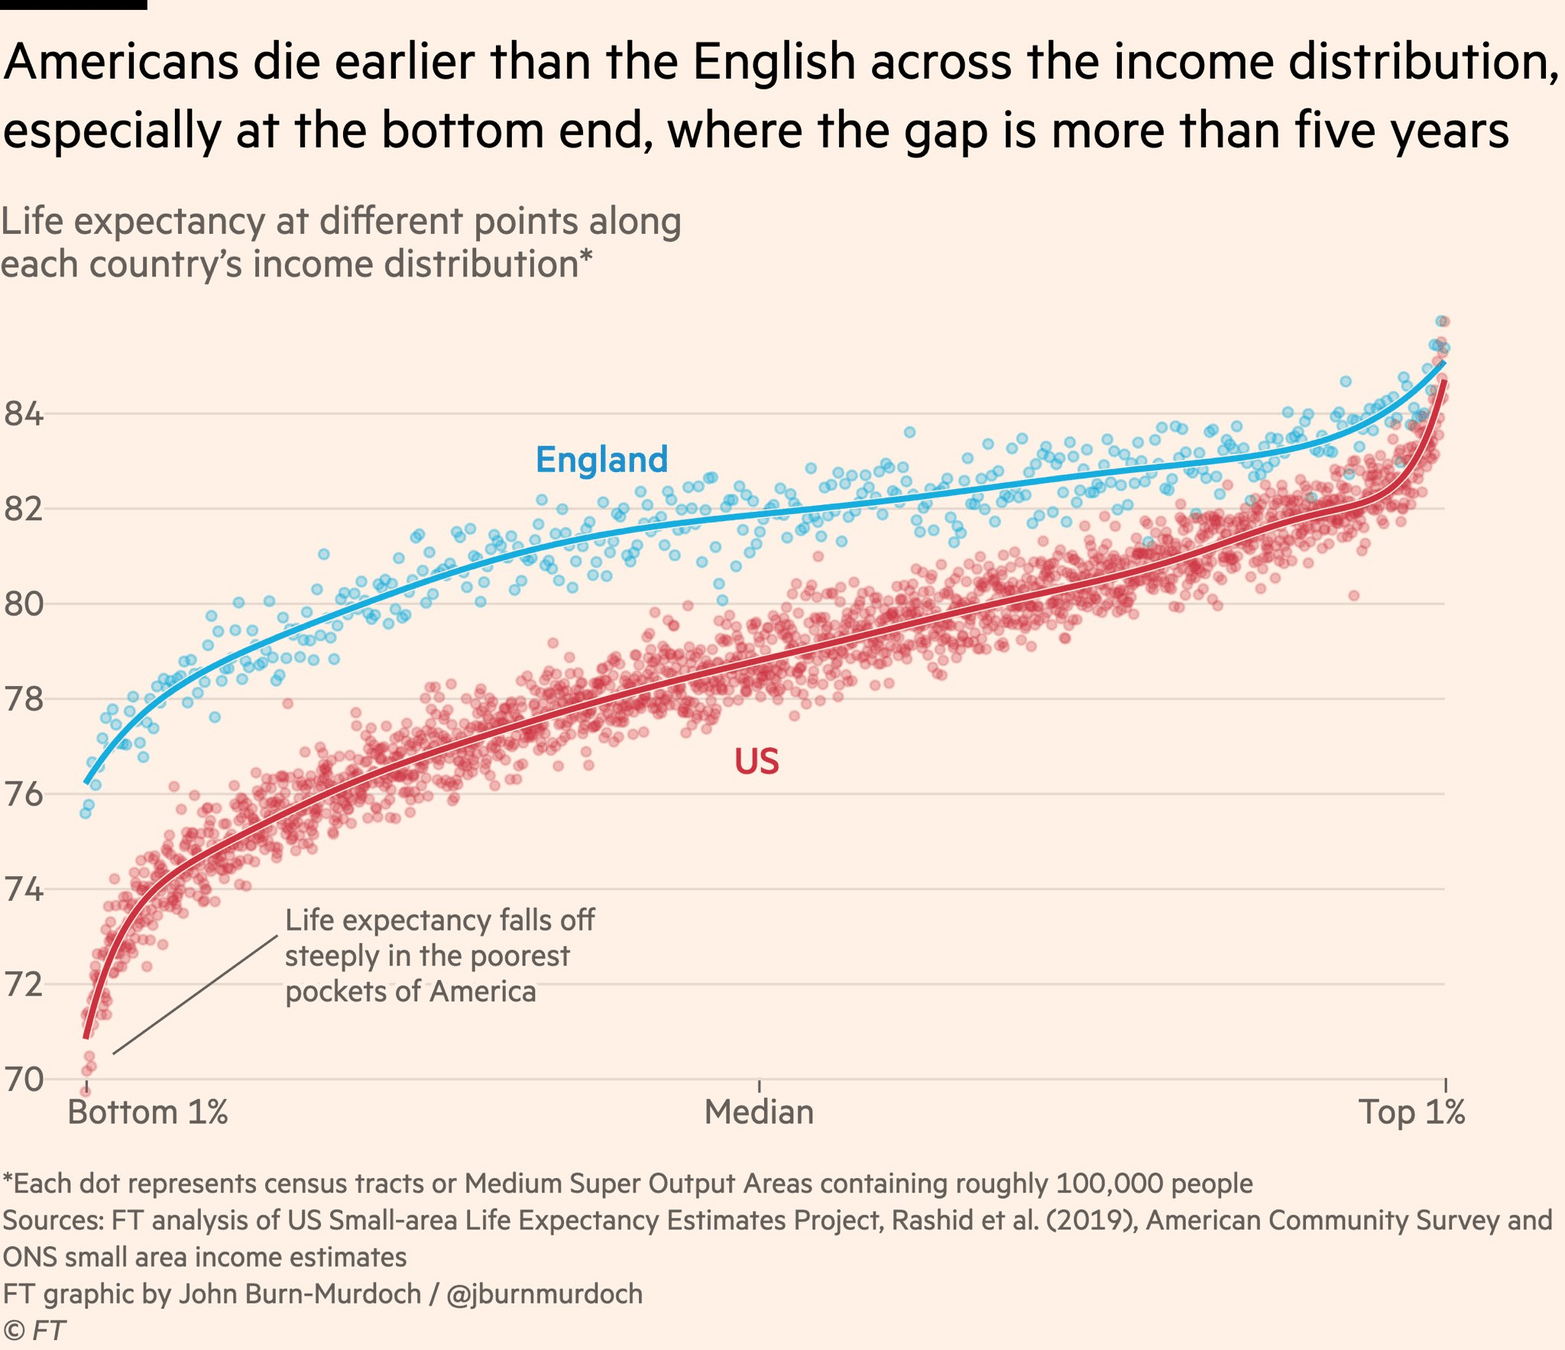
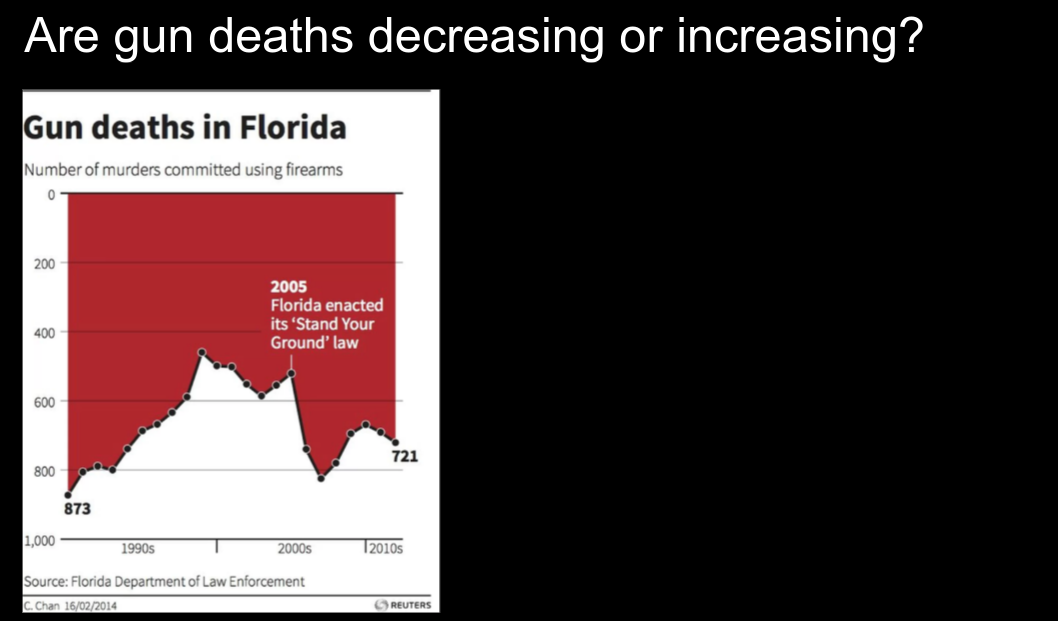
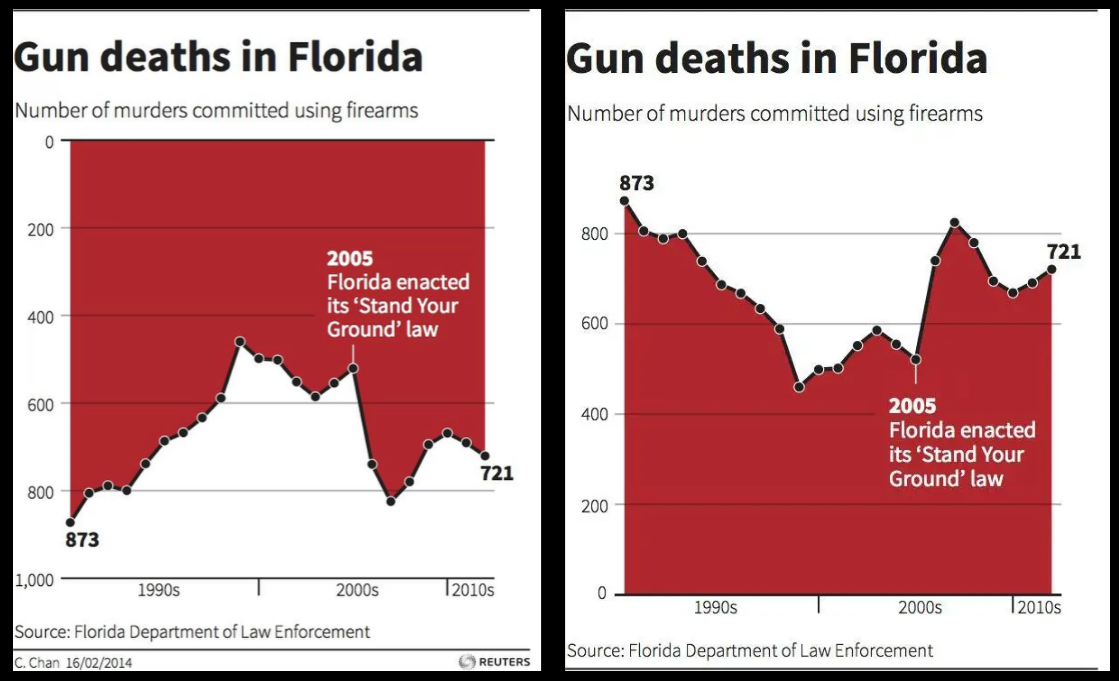
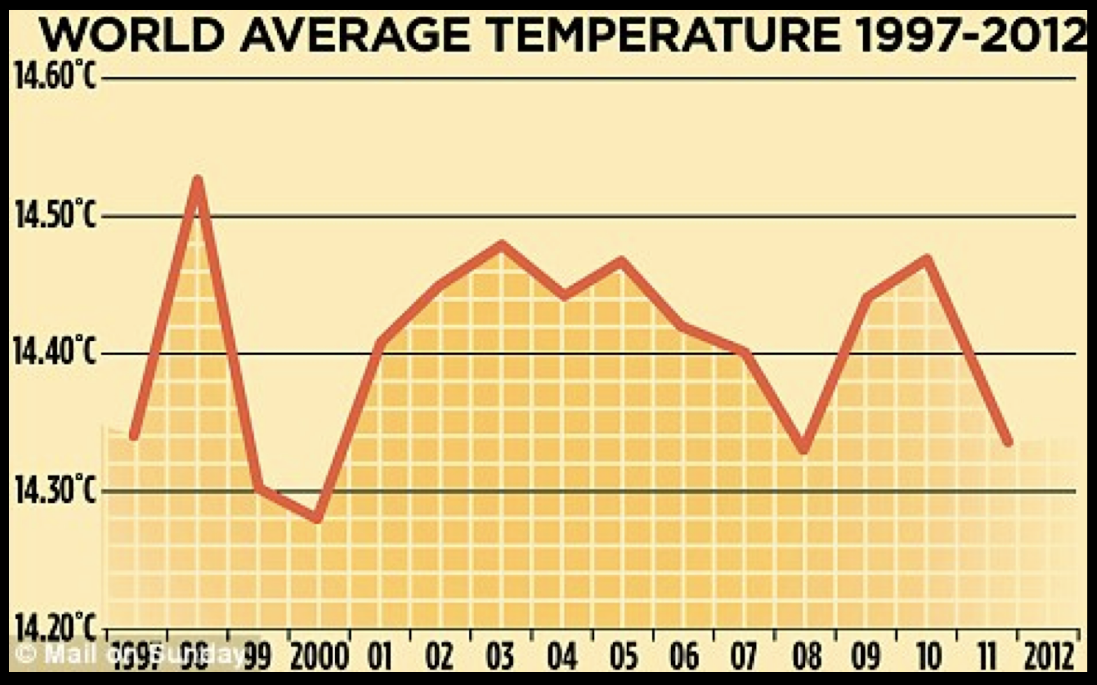
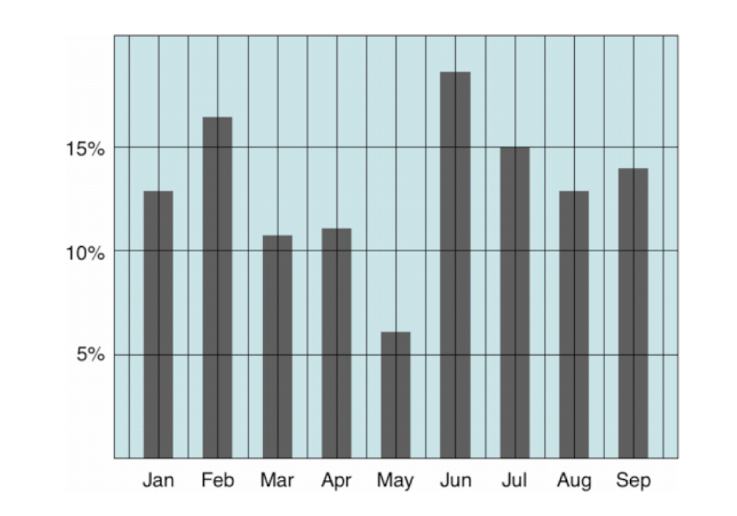
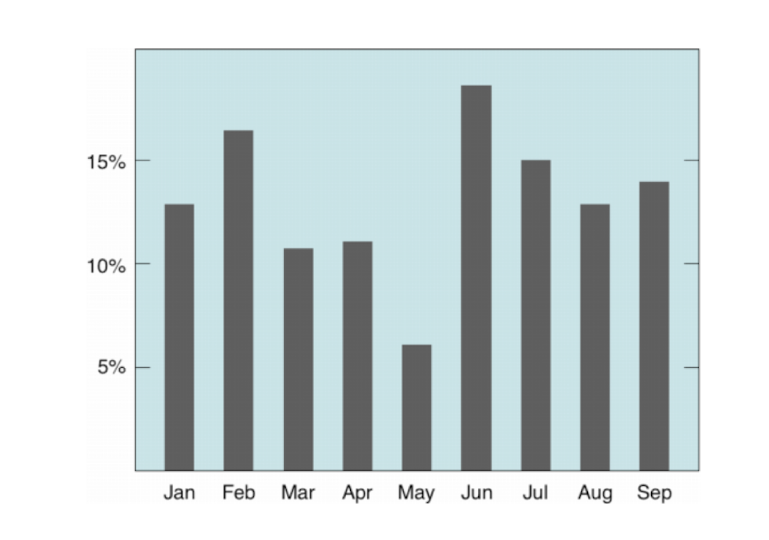
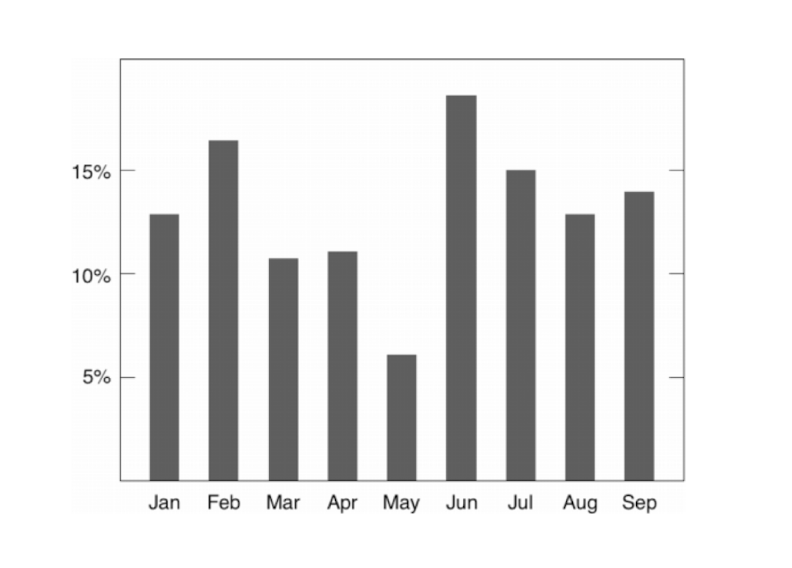
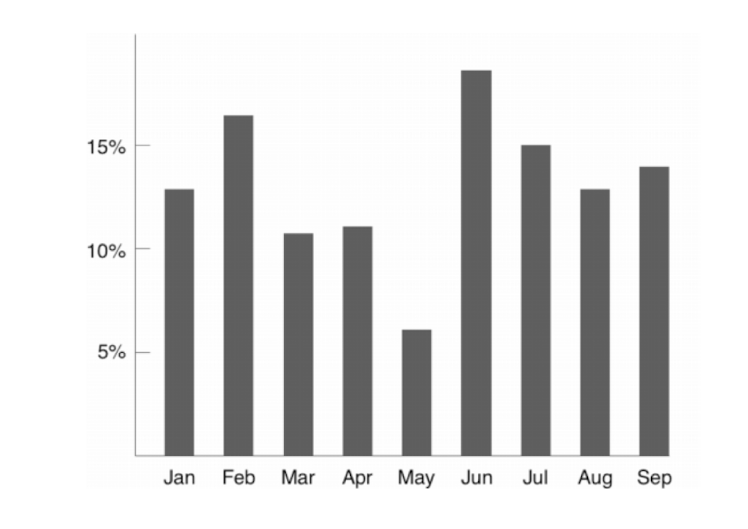
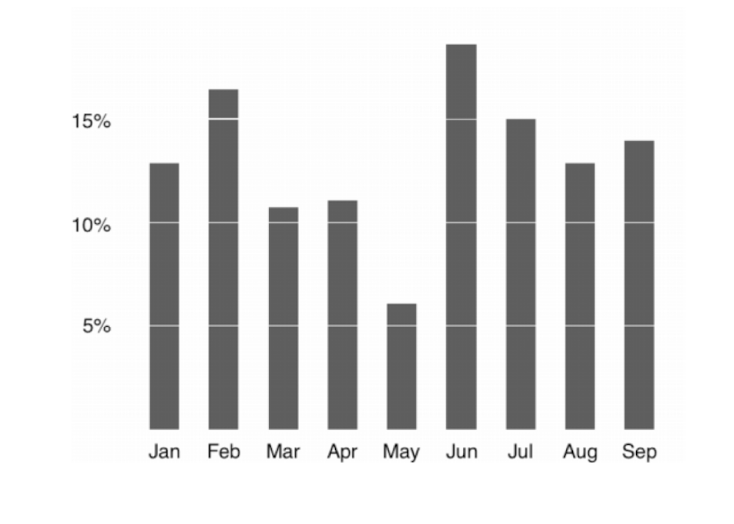
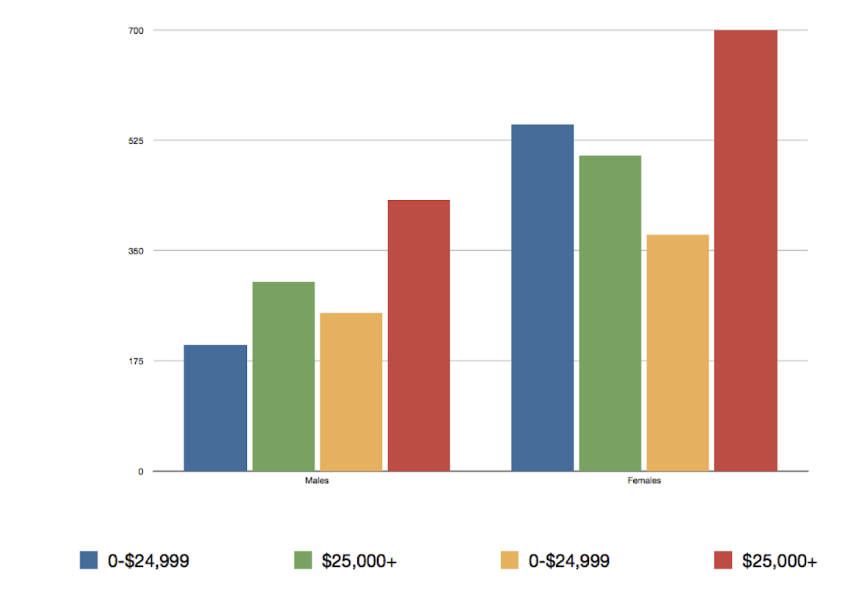
Let's make a chart beautiful!
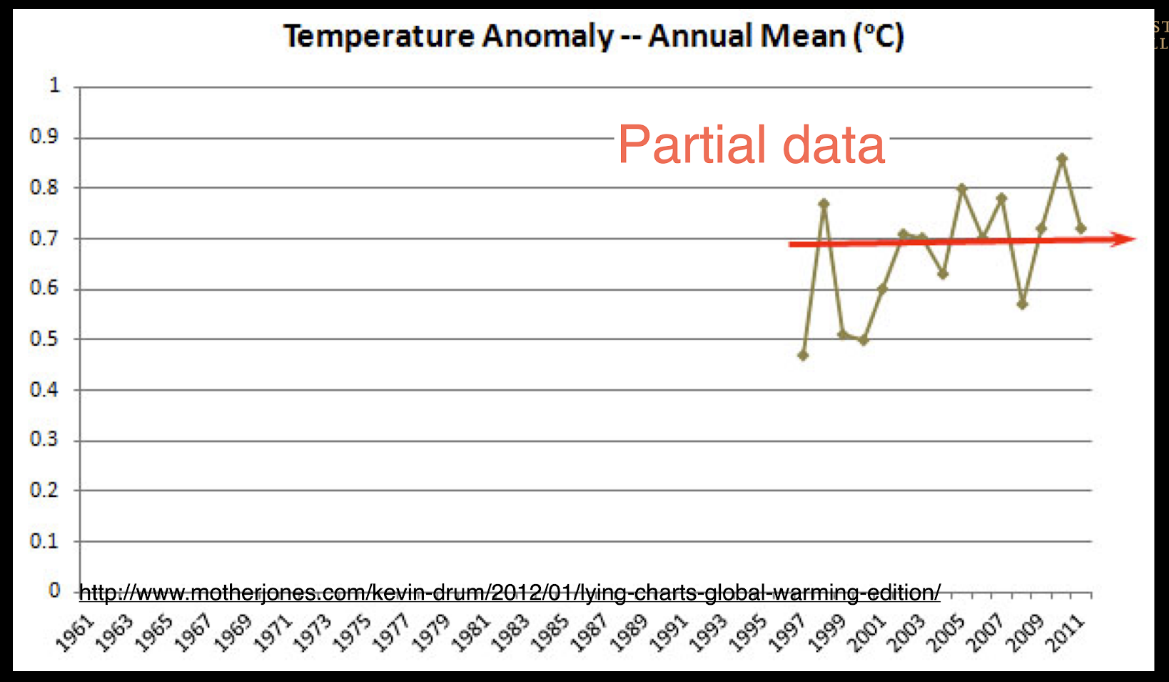
What's wrong with this chart?
Source: World Bank
Choose 1 example of a bad visualization and
tell us what is wrong about it and how to improve it!
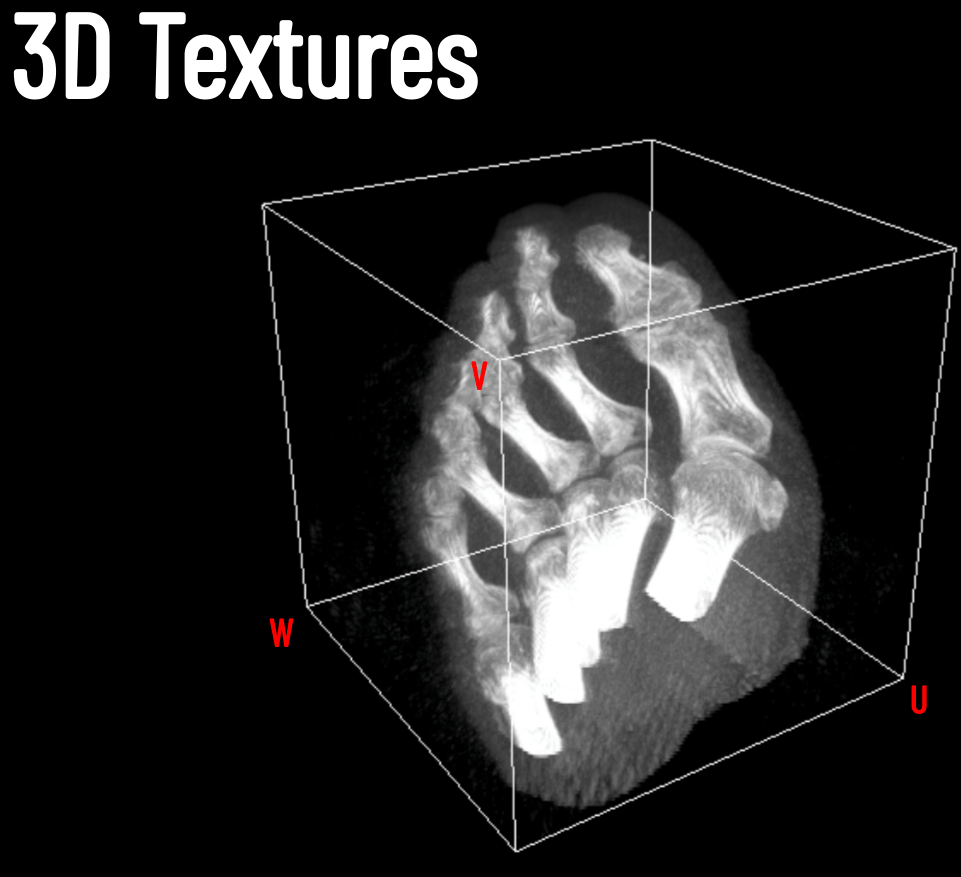
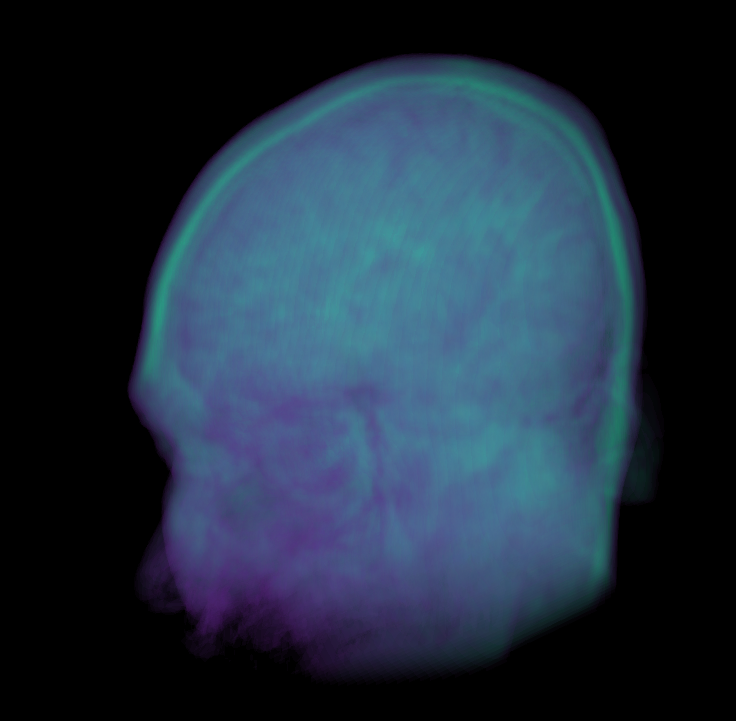
Scientific Visualization
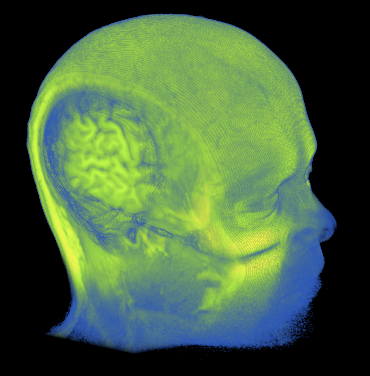
Brain Camera
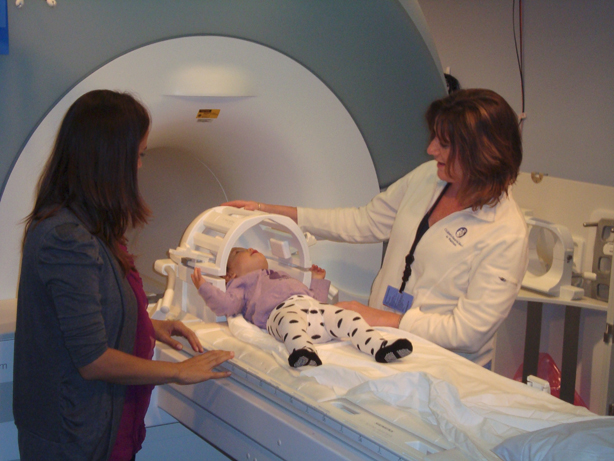
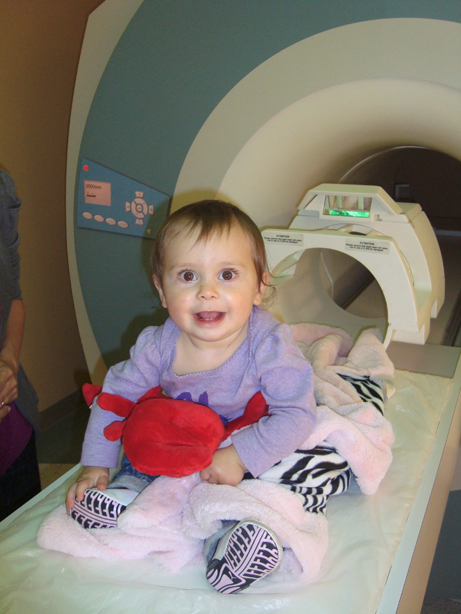
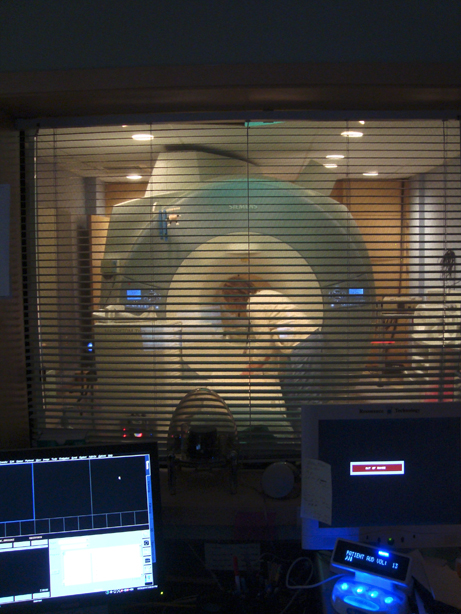
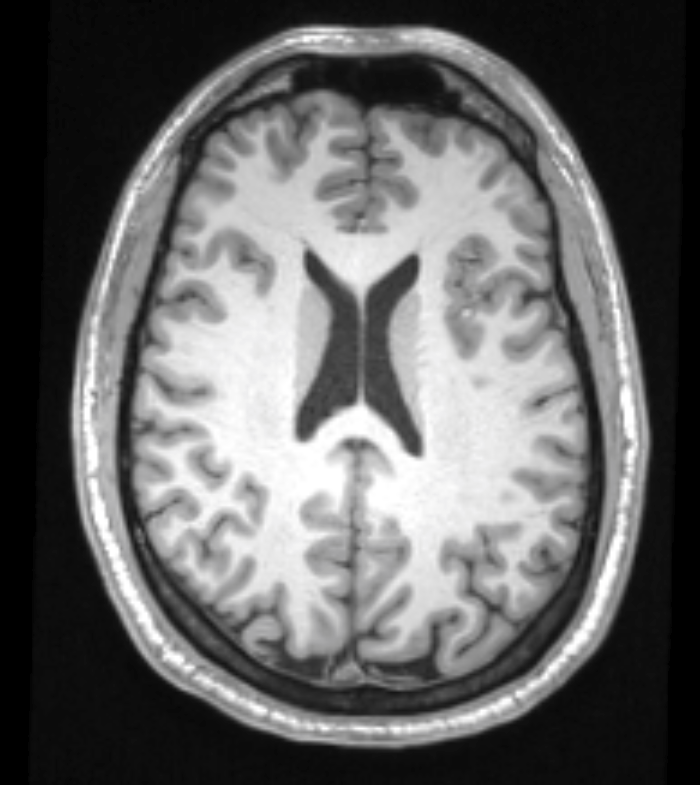
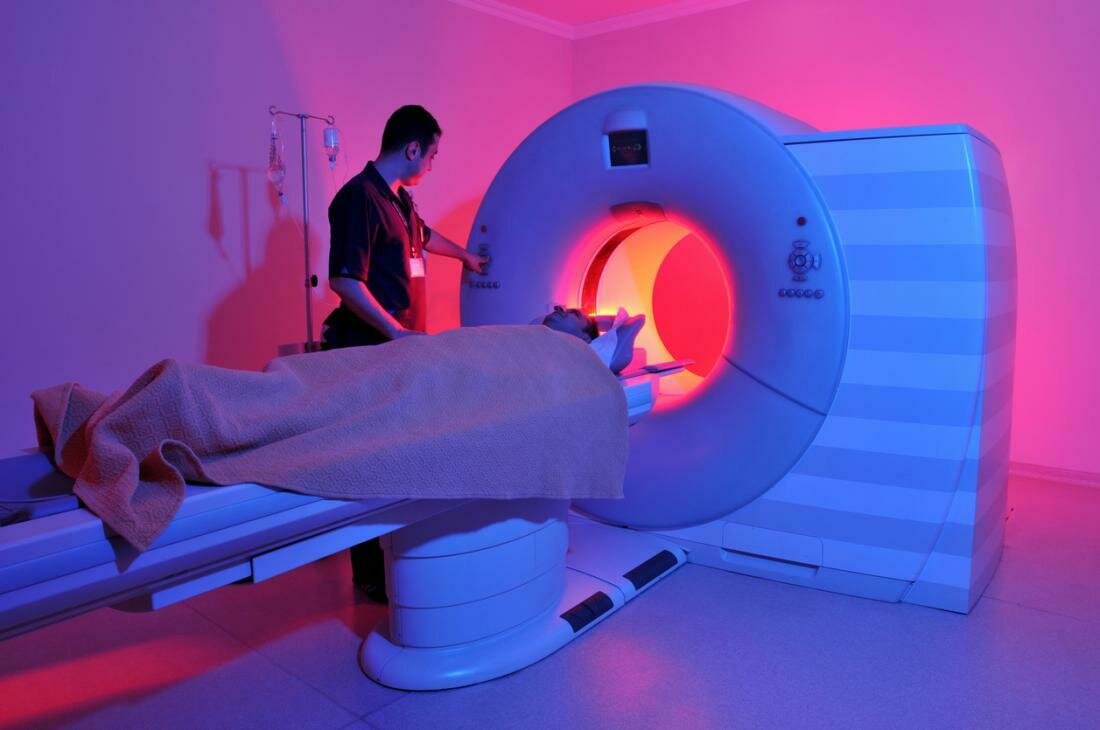
MRI Scanner
CT Scanner
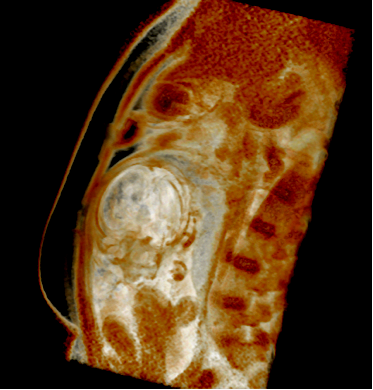
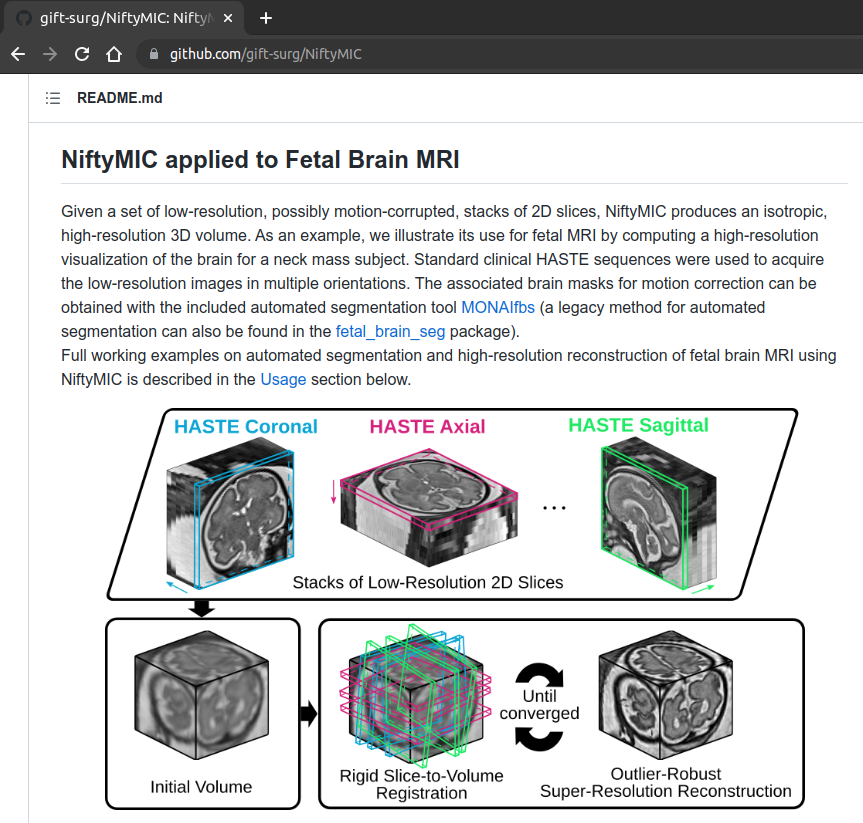
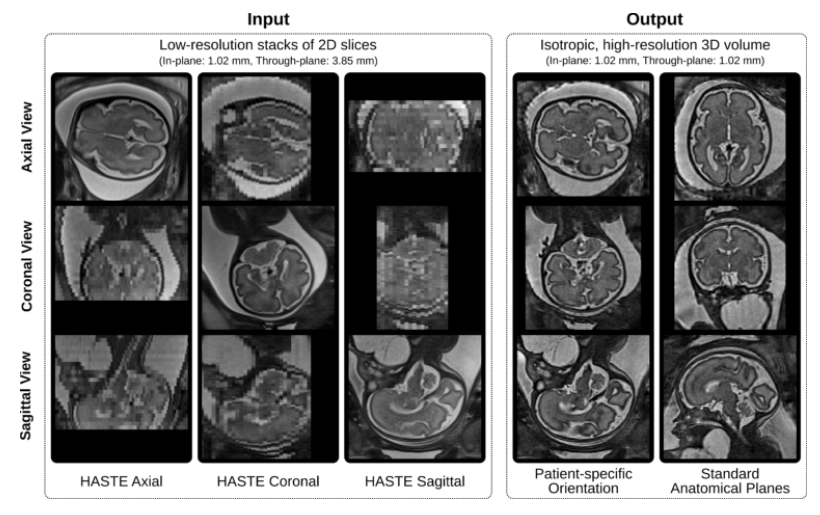
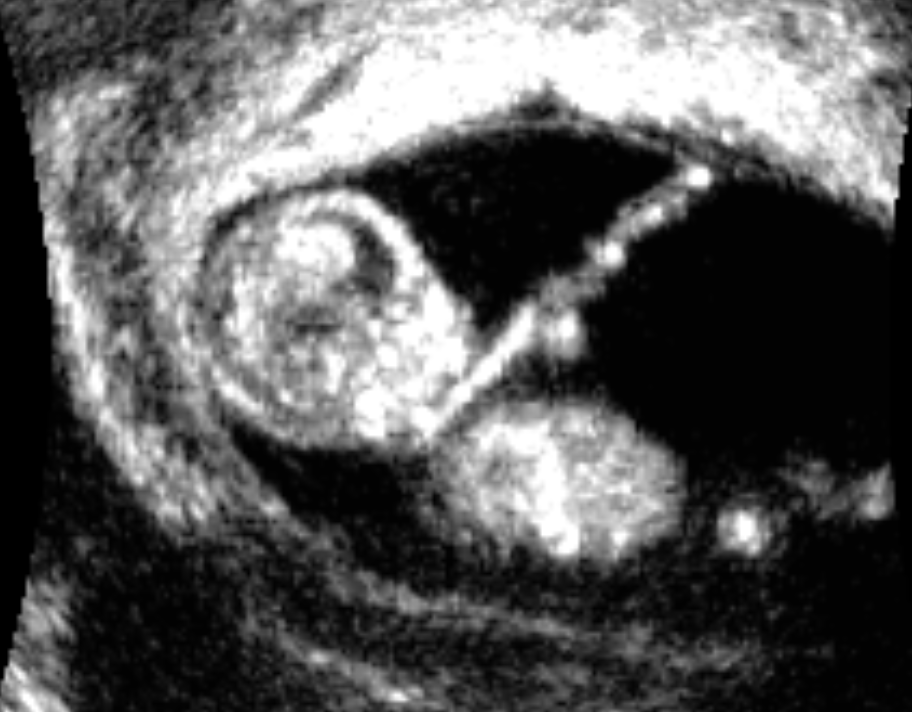
Fetal MRI
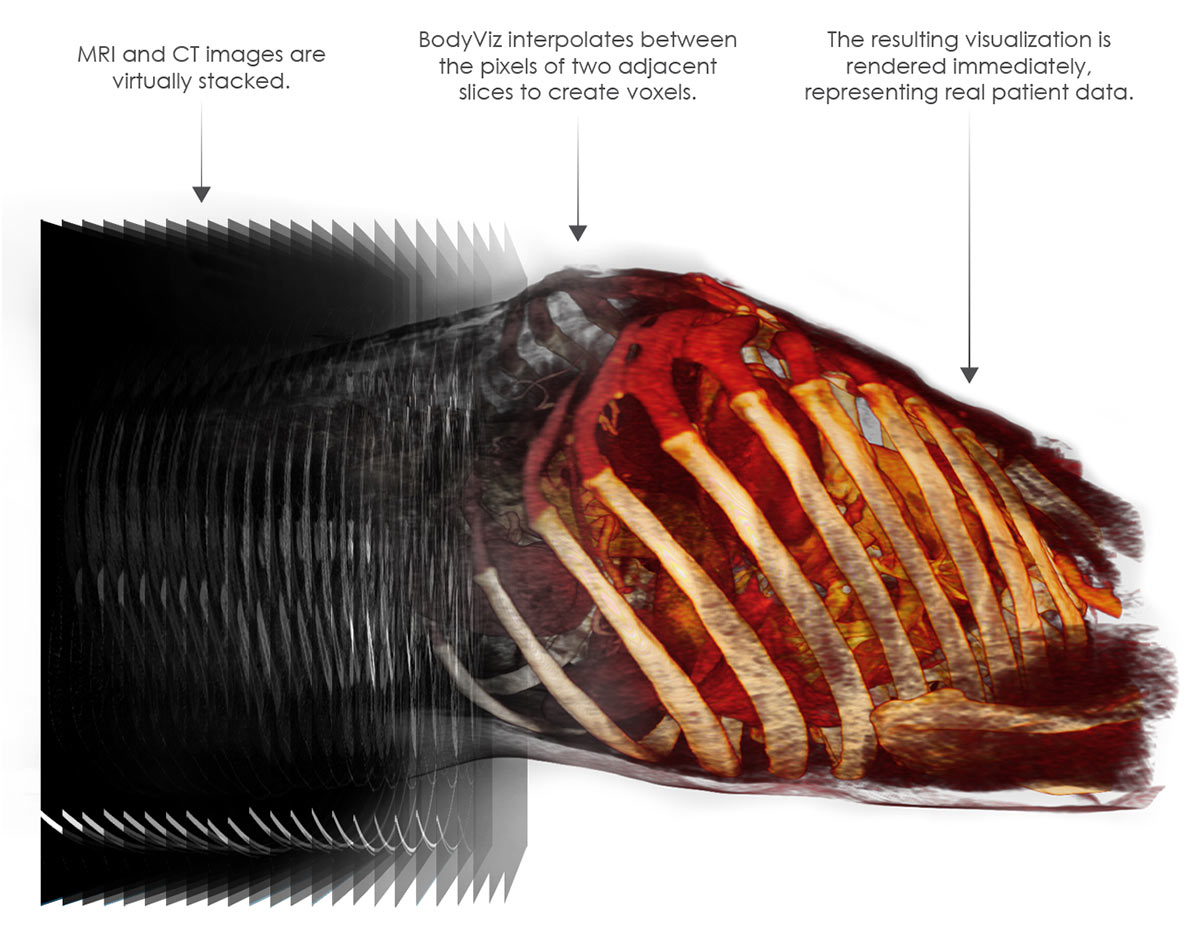
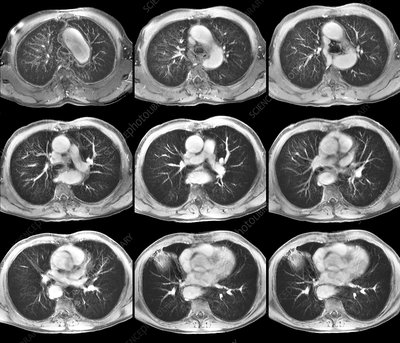
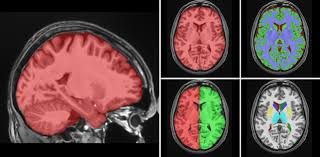
Image Volumes
2D
3D
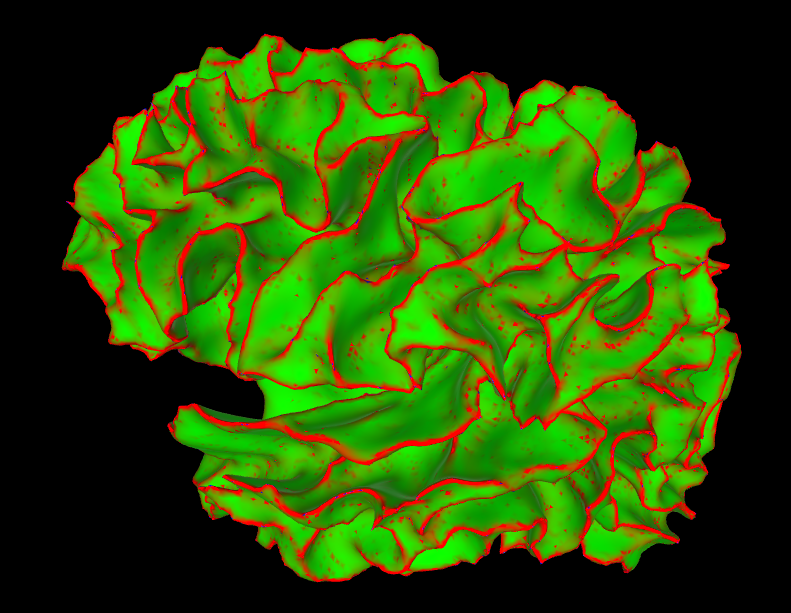
Marching Cubes creates 3D Meshes
Bill Lorensen 1987
Label Maps
R.I.P.
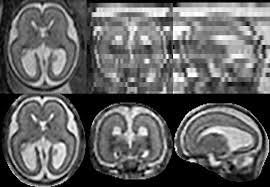
Coronal
Super-Resolution
Coronal
Super-Resolution
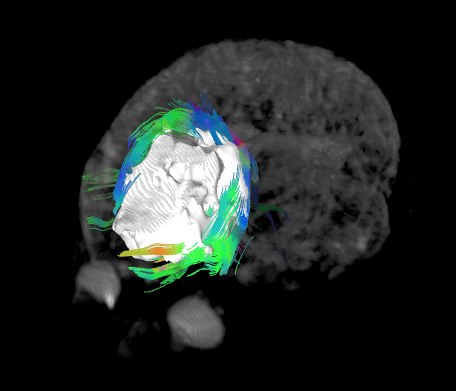
Image Volumes
Meshes
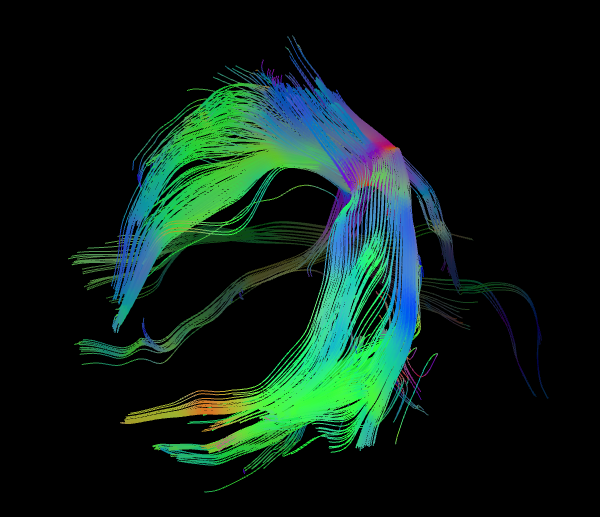
DTI Fibers
Radiology
0.1 - 1 mm^3 voxel size
< 1 Gigabyte
MeshAR
FibersAR
GPU Access!
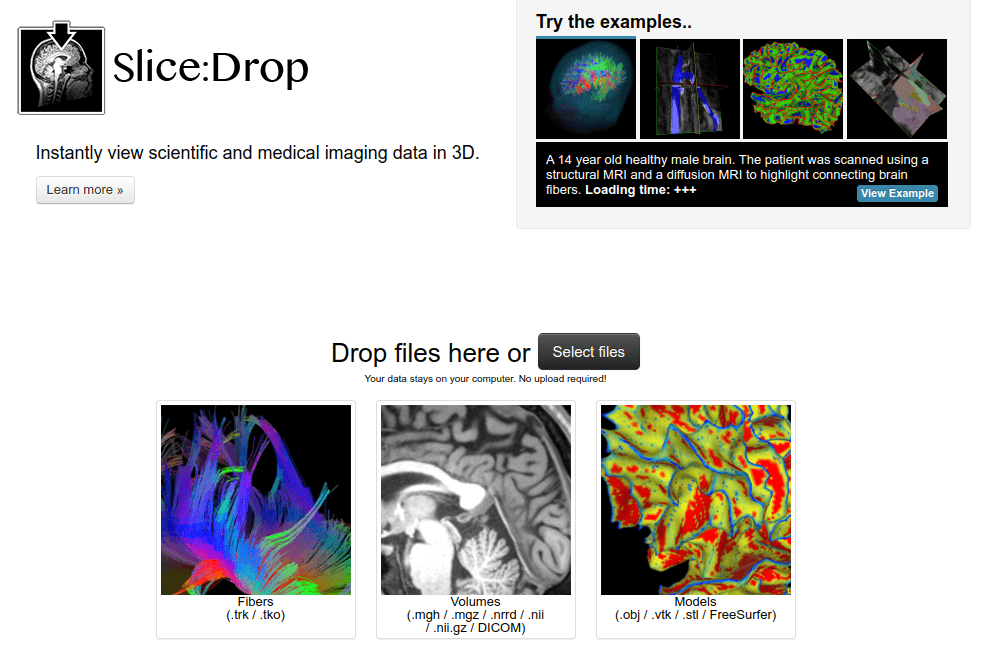
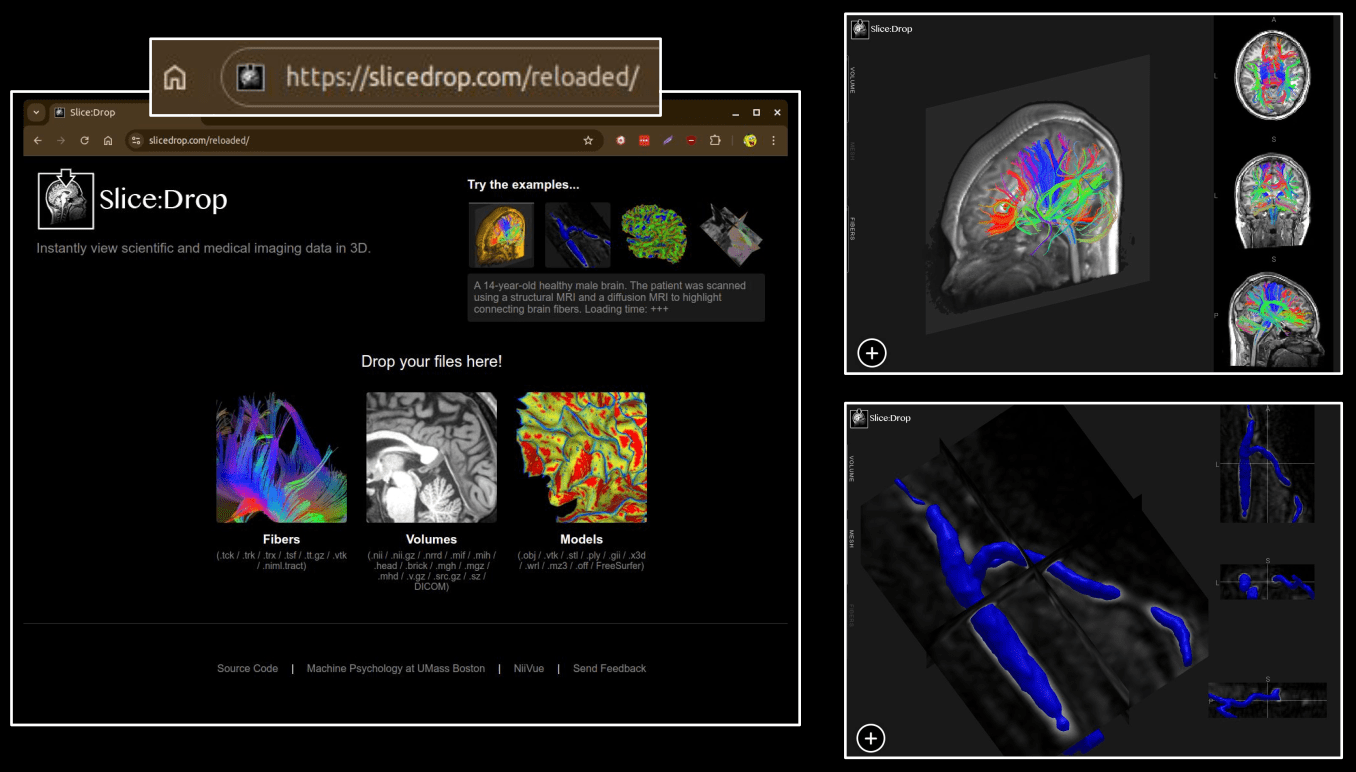
the most popular one!
XTK: the easiest!
brandnew + fast
<html>
<head>
  <style>

    body {
      background: black;
      margin: 0;
      padding: 0;
      overflow: hidden !important;
    }

  </style>

  <script type="text/javascript" src="https://get.goXTK.com/xtk_edge.js"></script>
  <script>

  window.onload = function() {

    r = new X.renderer3D();
    r.init();

    tumor = new X.mesh();
    tumor.file = 'tumor.vtk';

    r.add(tumor);


    tracks = new X.fibers();
    tracks.file = 'tracks.trk';

    r.add(tracks);


    volume = new X.volume();
    volume.file = 'volume.nii';

    r.add(volume);

    r.render();


  }
  </script>
</head>

<body>
</body>
</html>
MRI
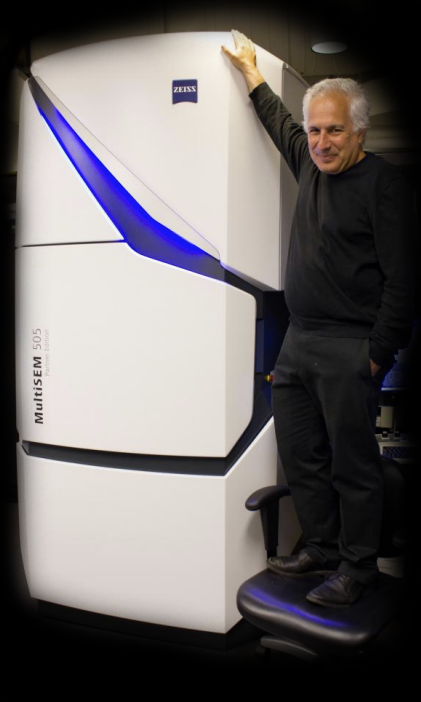
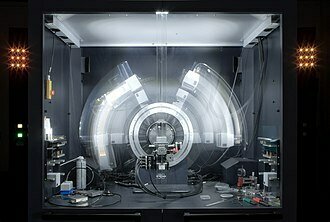
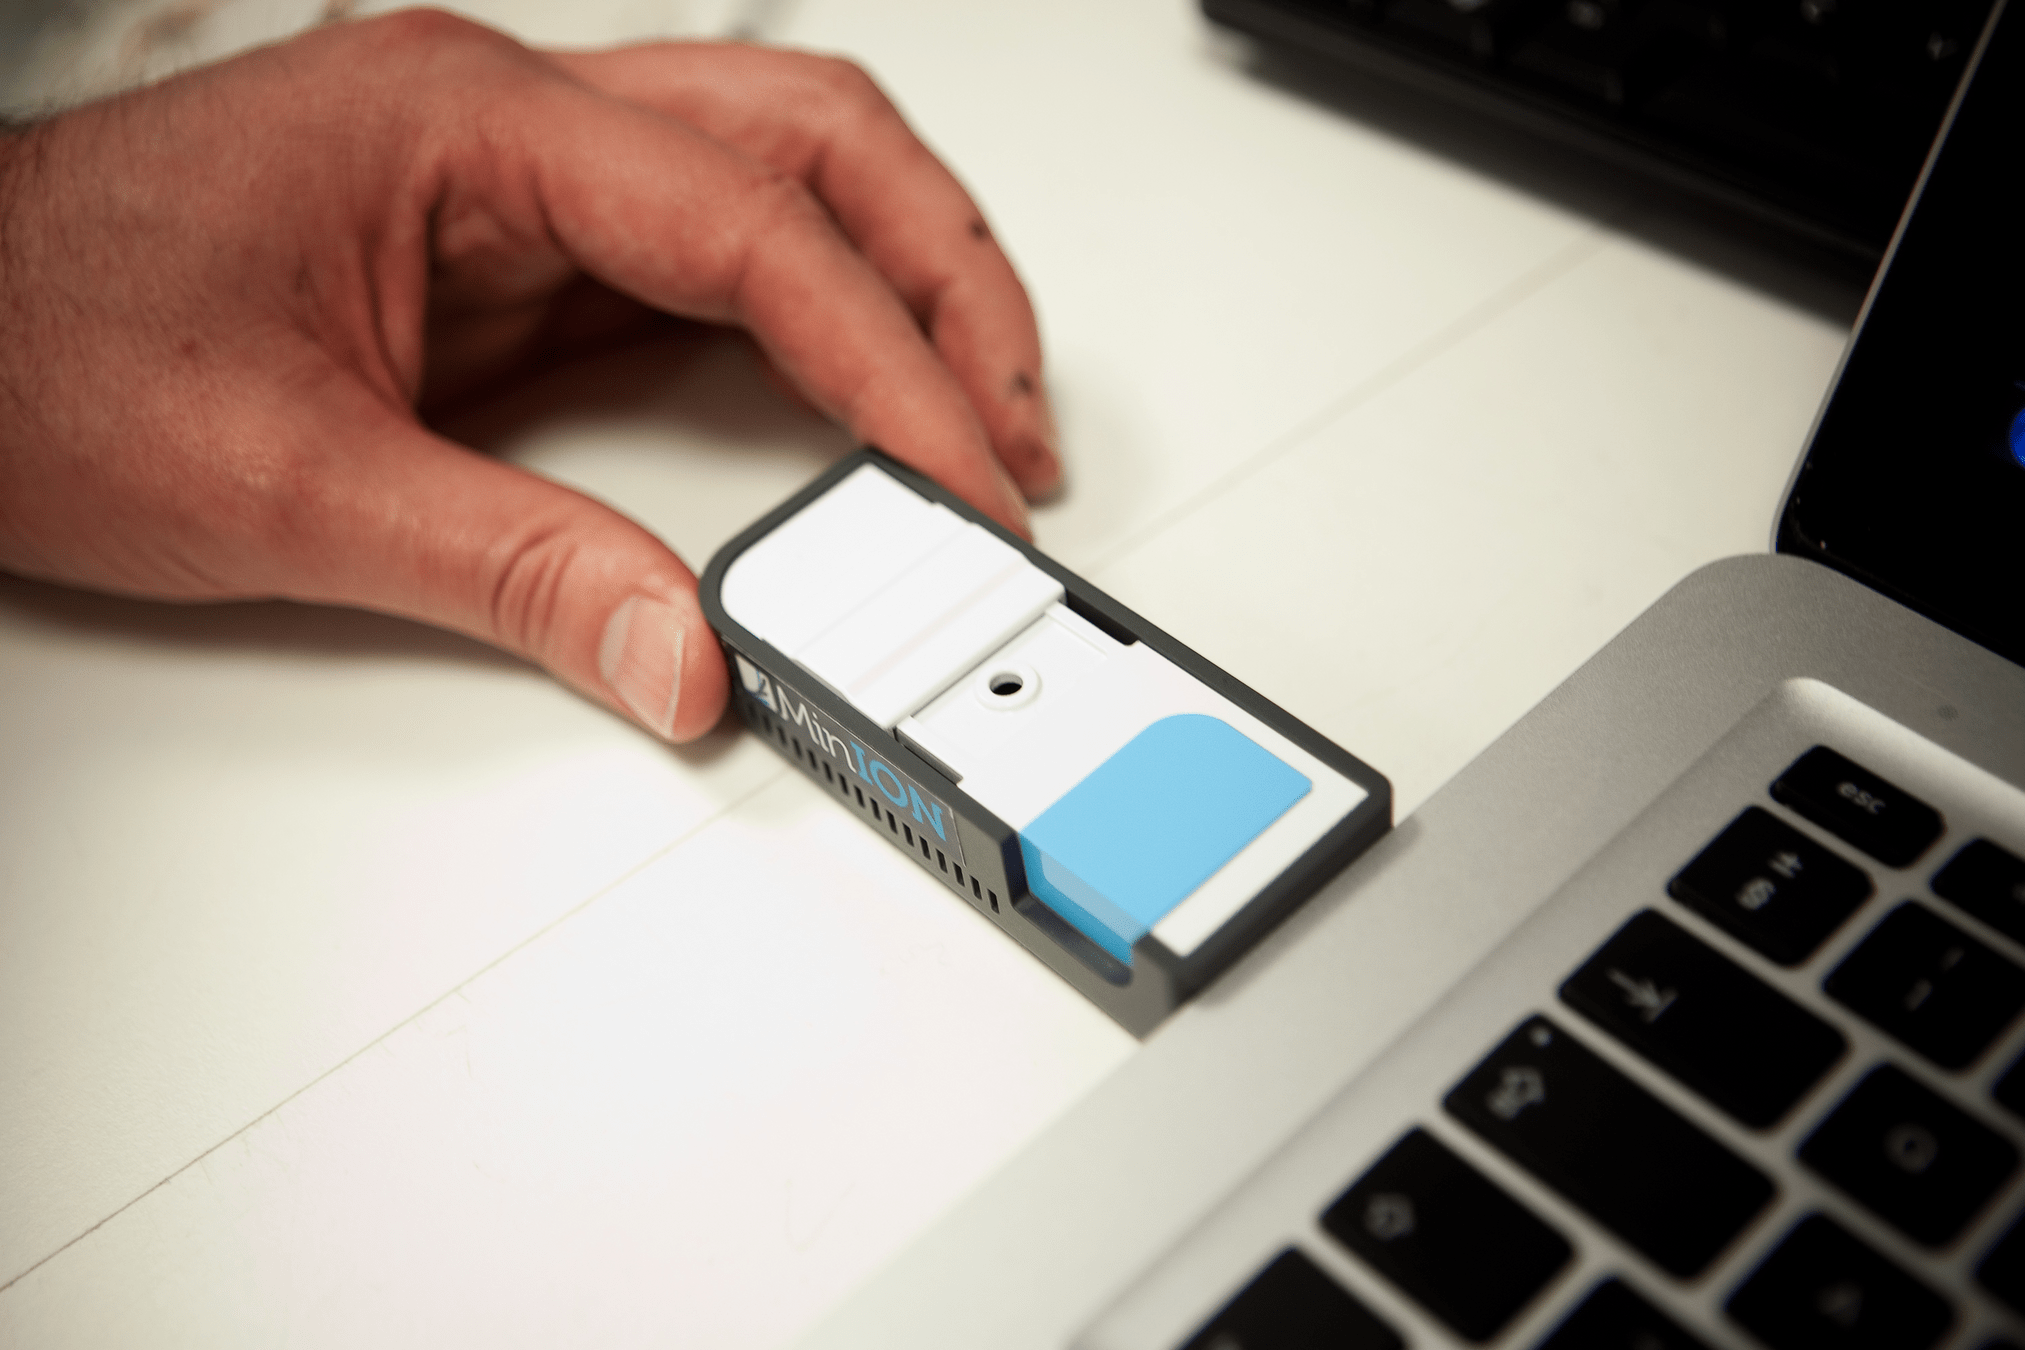
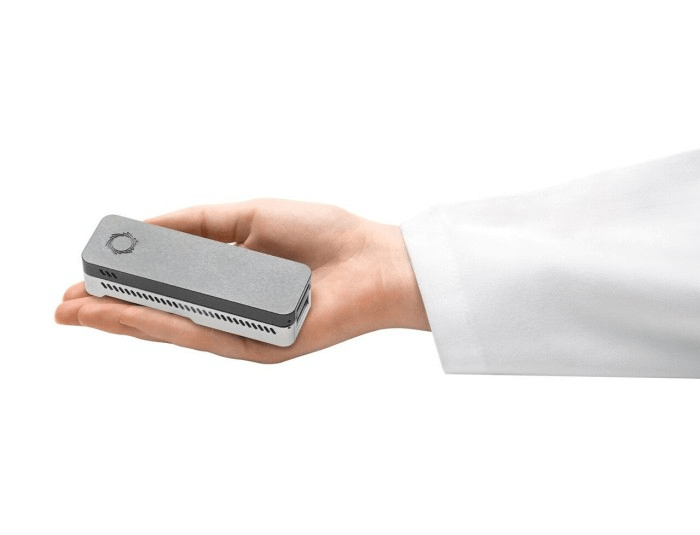
Electron Microscope
millimeter resolution
nanometer resolution
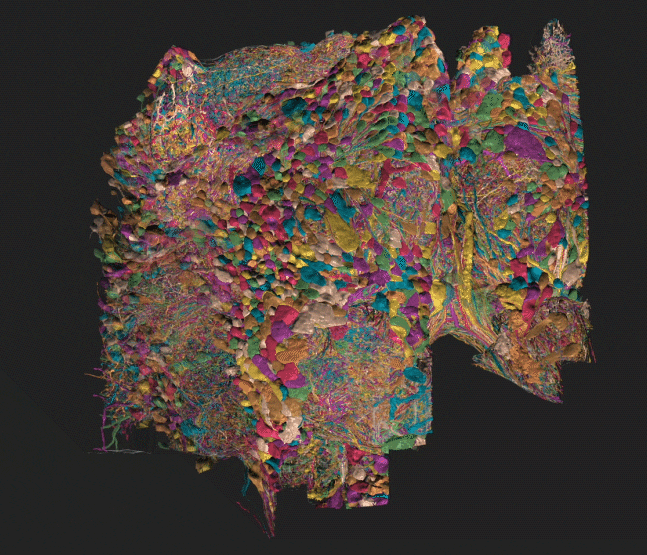
Connectomics
Brain Connectivity at Synapse Level
nanometer resolution!
tera- or petabytes of data!
Drosophila Hemibrain Connectome
8x8x8nm^3 voxel size
~25,000 neurons
Google + Janelia
X-ray Crystallography
MRI
Electron Microscope
one ten-billionth (10^-10) of a meter
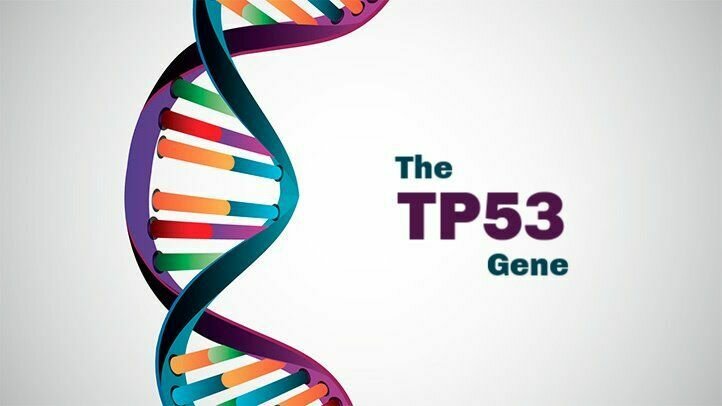
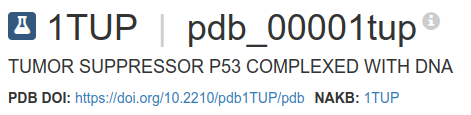
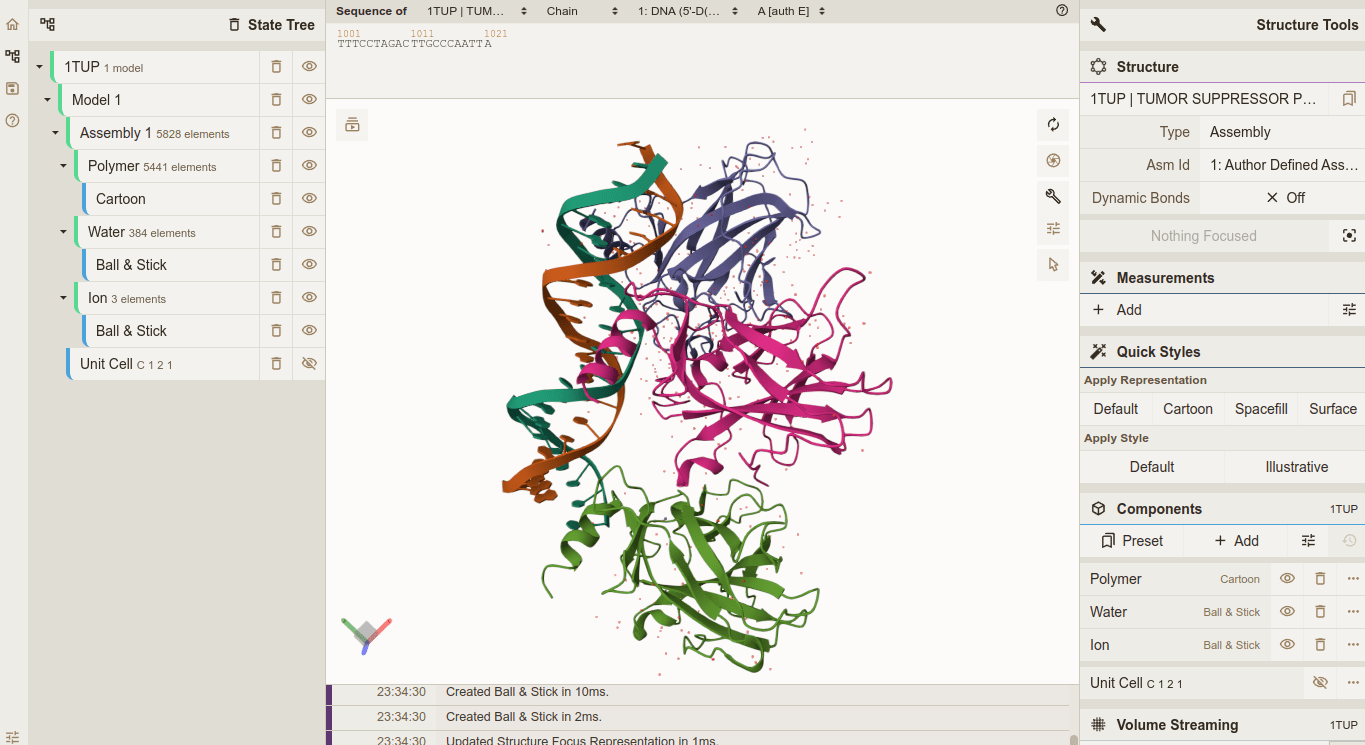
Why is it called "guardian of the genome"?
p53 helps prevent cancer development by inhibiting growth and division of cells which damage DNA.
mutations in p53 are found in approximately half of all cancers!
Tumor Suppressor
Cho Y, Gorina S, Jeffrey PD, Pavletich NP. Crystal structure of a p53 tumor suppressor-DNA complex: understanding tumorigenic mutations. Science. 1994 Jul 15;265(5170):346-55.
find me (follow the ) and connect on LinkedIn!
By Daniel Haehn
Research Immersion in Cancer Genomics: Genomics & Data Science Workshop


