


Ishanu Chattopadhyay PRO
ML | Data Science Biomedical Informatics | Social Science | Assistant Professor
&
Beyond
Ishanu Chattopadhyay, PhD
Assistant Professor of Biomedical Informatics & Computer Science
University of Kentucky
Boston U
U Chicago
Two centers
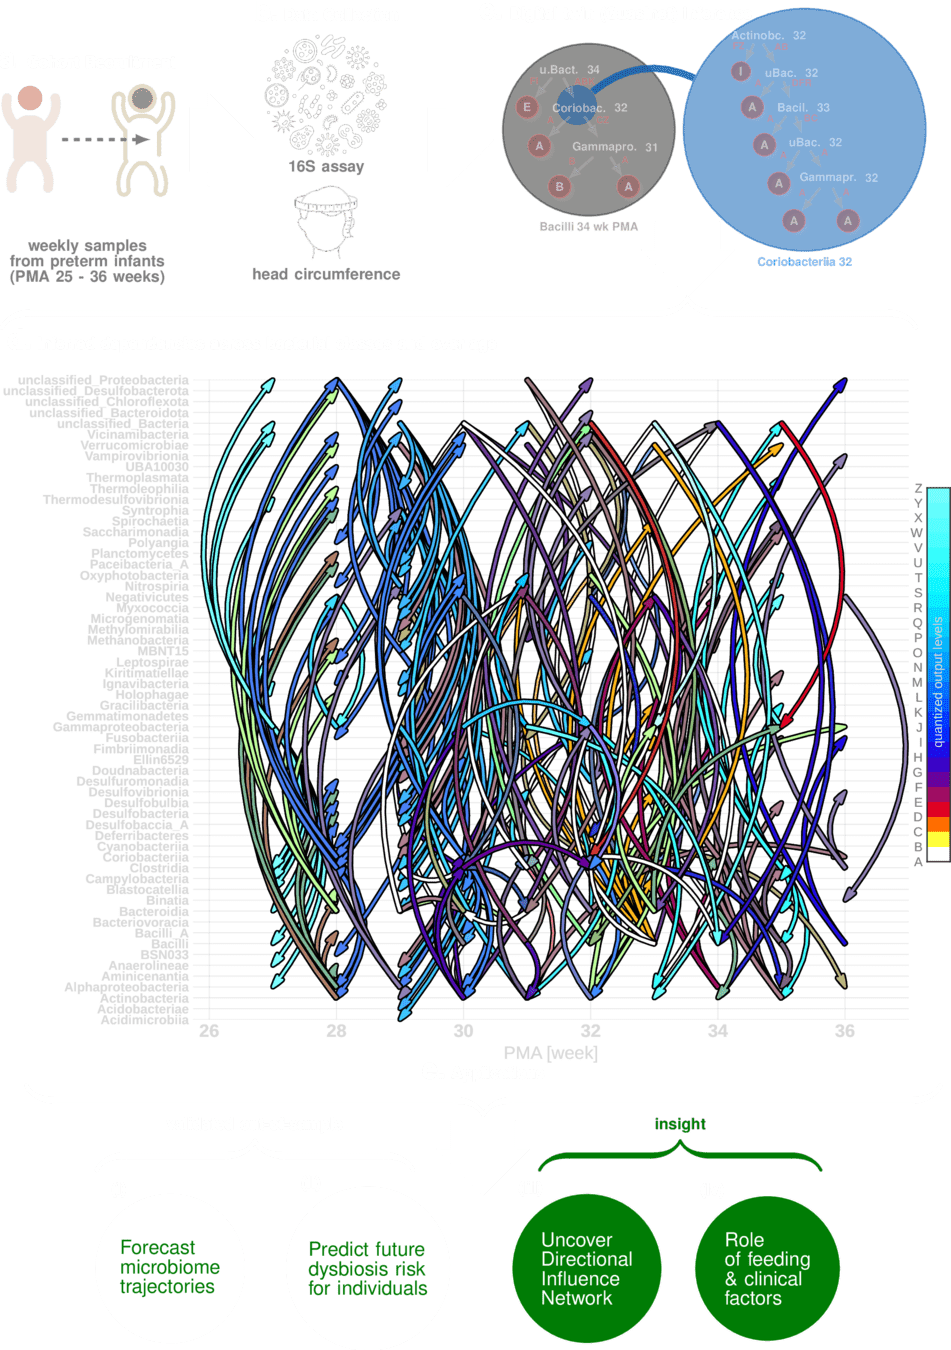
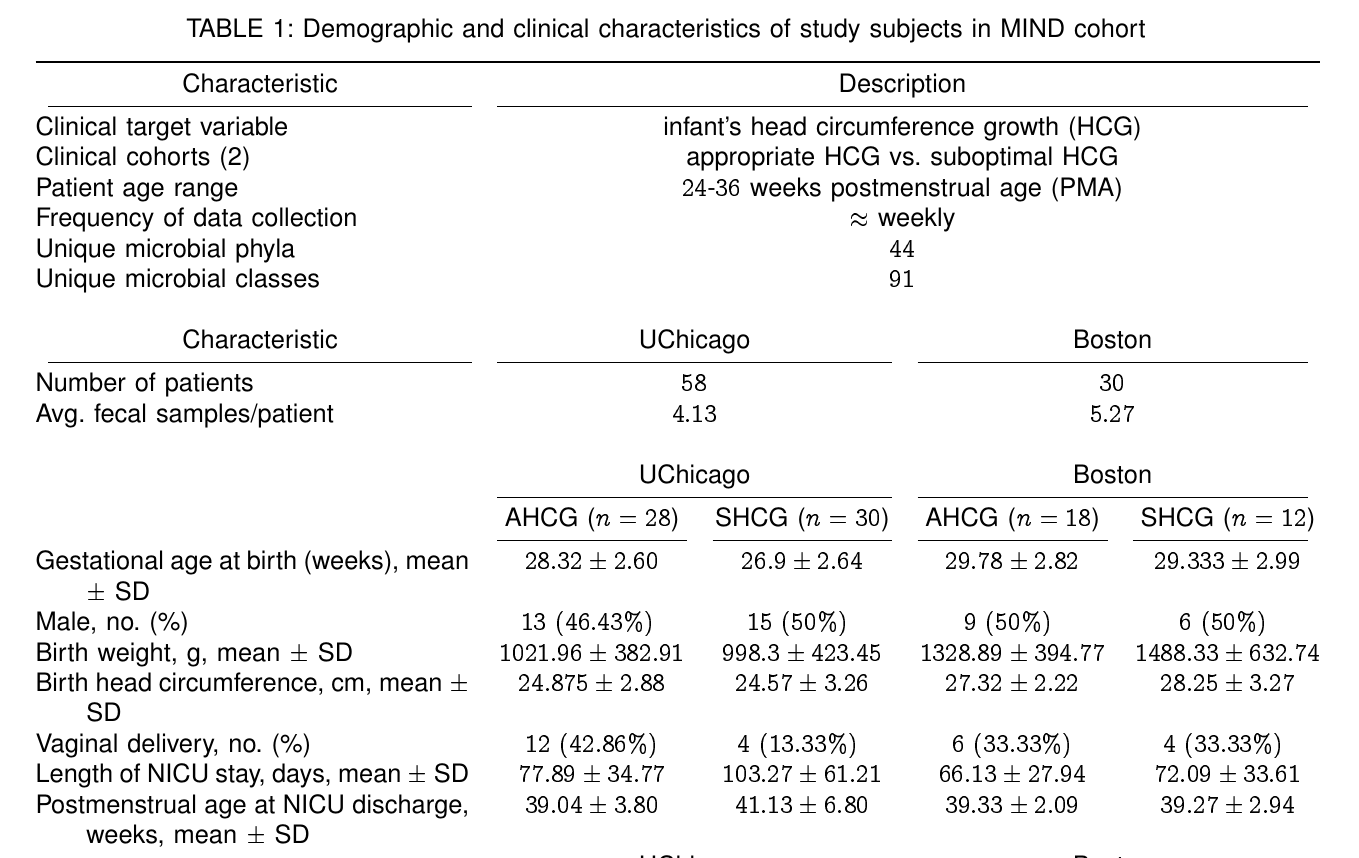
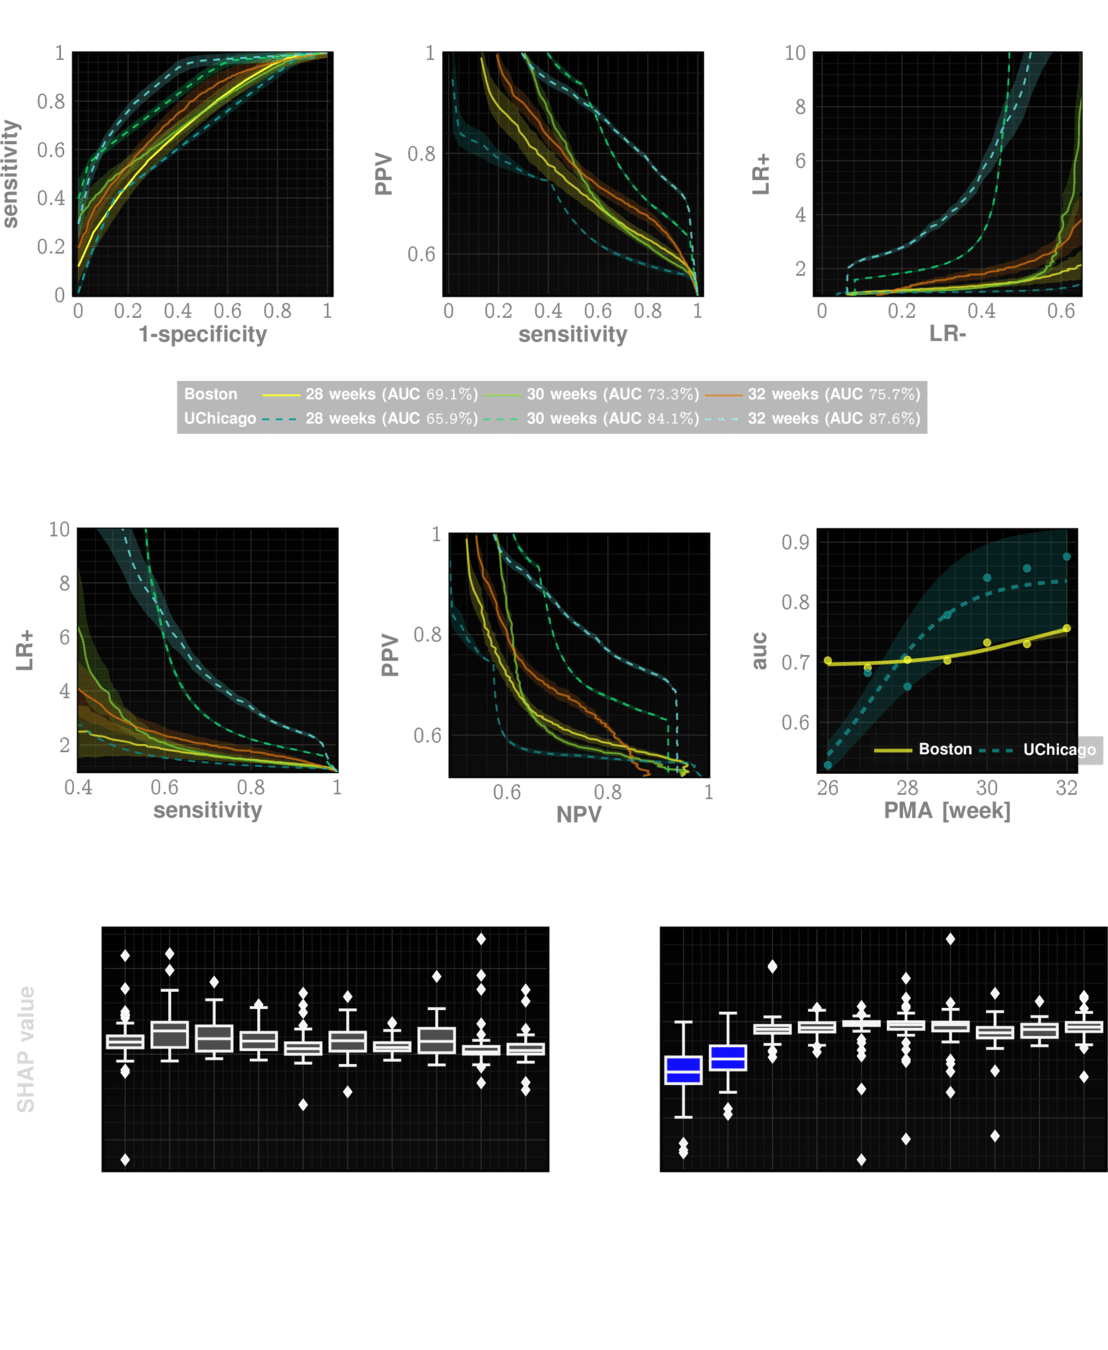
Sizemore, Nicholas, Kaitlyn Oliphant, Ruolin Zheng, Camilia R. Martin, Erika C. Claud, and Ishanu Chattopadhyay. "A digital twin of the infant microbiome to predict neurodevelopmental deficits." Science Advances 10, no. 15 (2024): eadj0400.
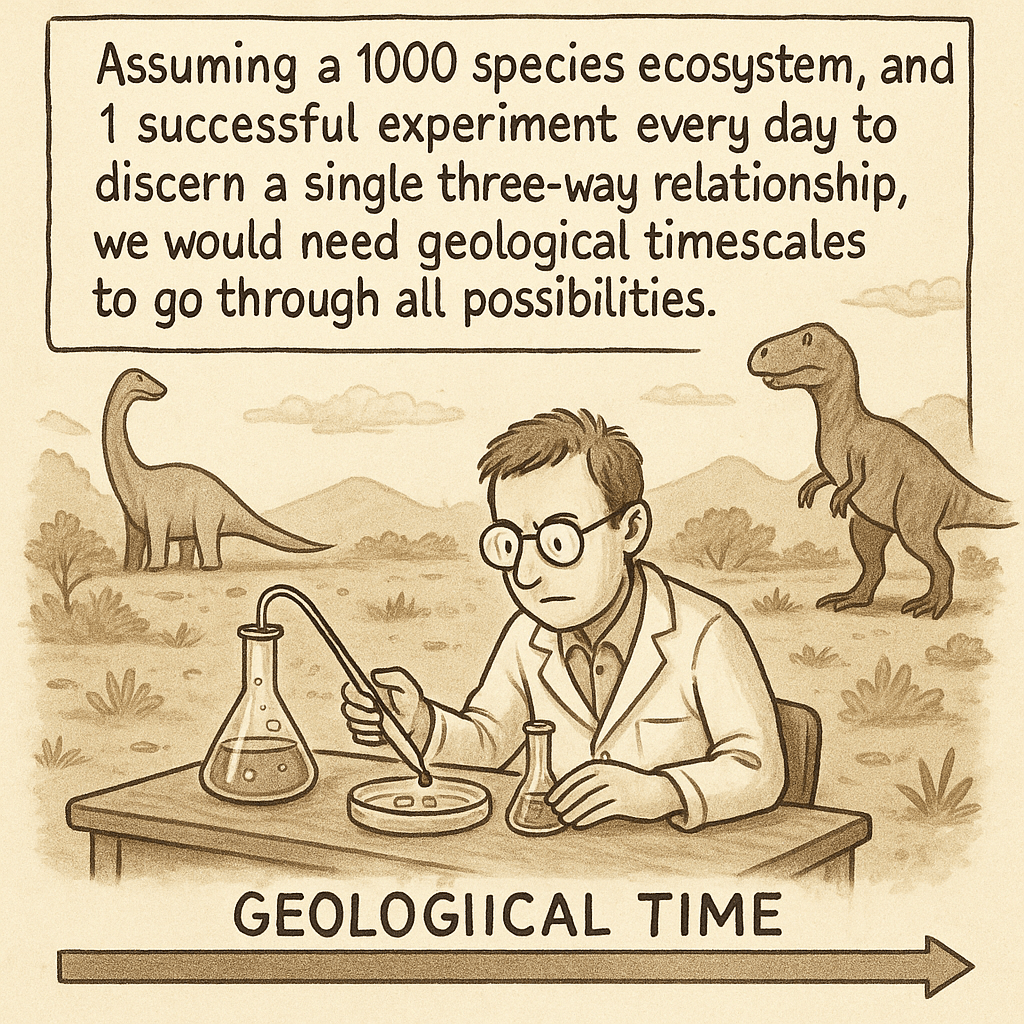
millions of years
(earlier called q-nets/ quasinets)
*Brook, D. (1964). On the distinction between the conditional probability and the joint probability distribution. Journal of the Royal Statistical Society. Series B (Methodological), 26(2), 295–307.
*Hothorn, Torsten, Kurt Hornik, and Achim Zeileis. "Unbiased recursive partitioning: A conditional inference framework." Journal of Computational and Graphical statistics 15, no. 3 (2006): 651-674.
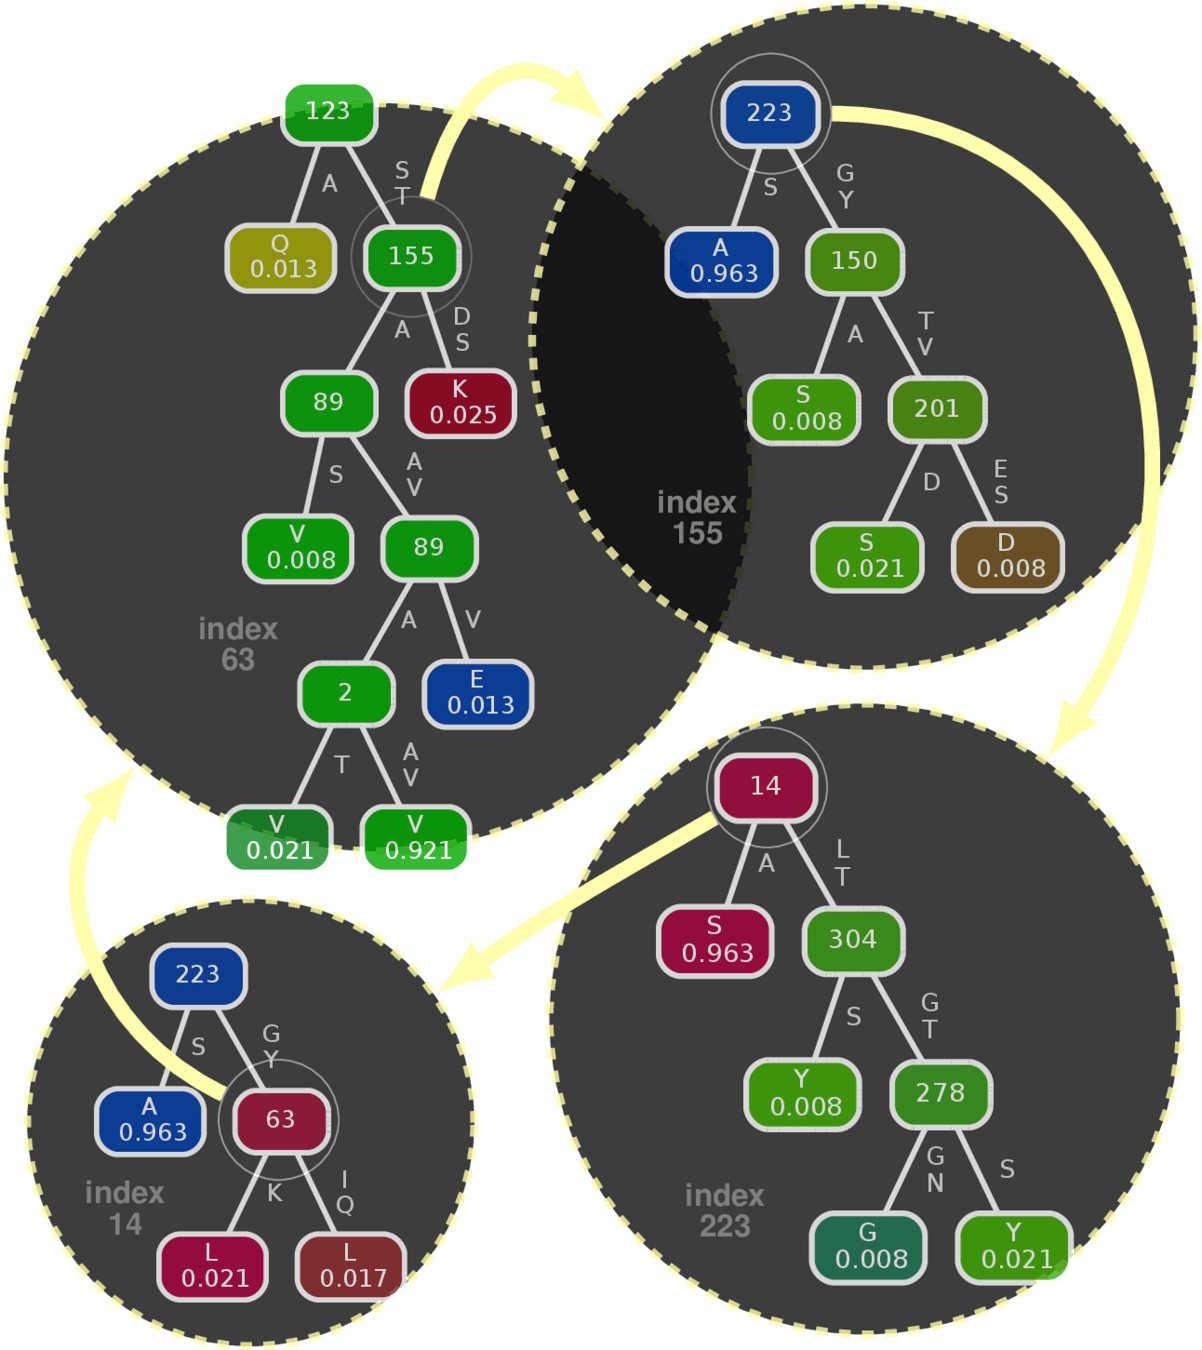
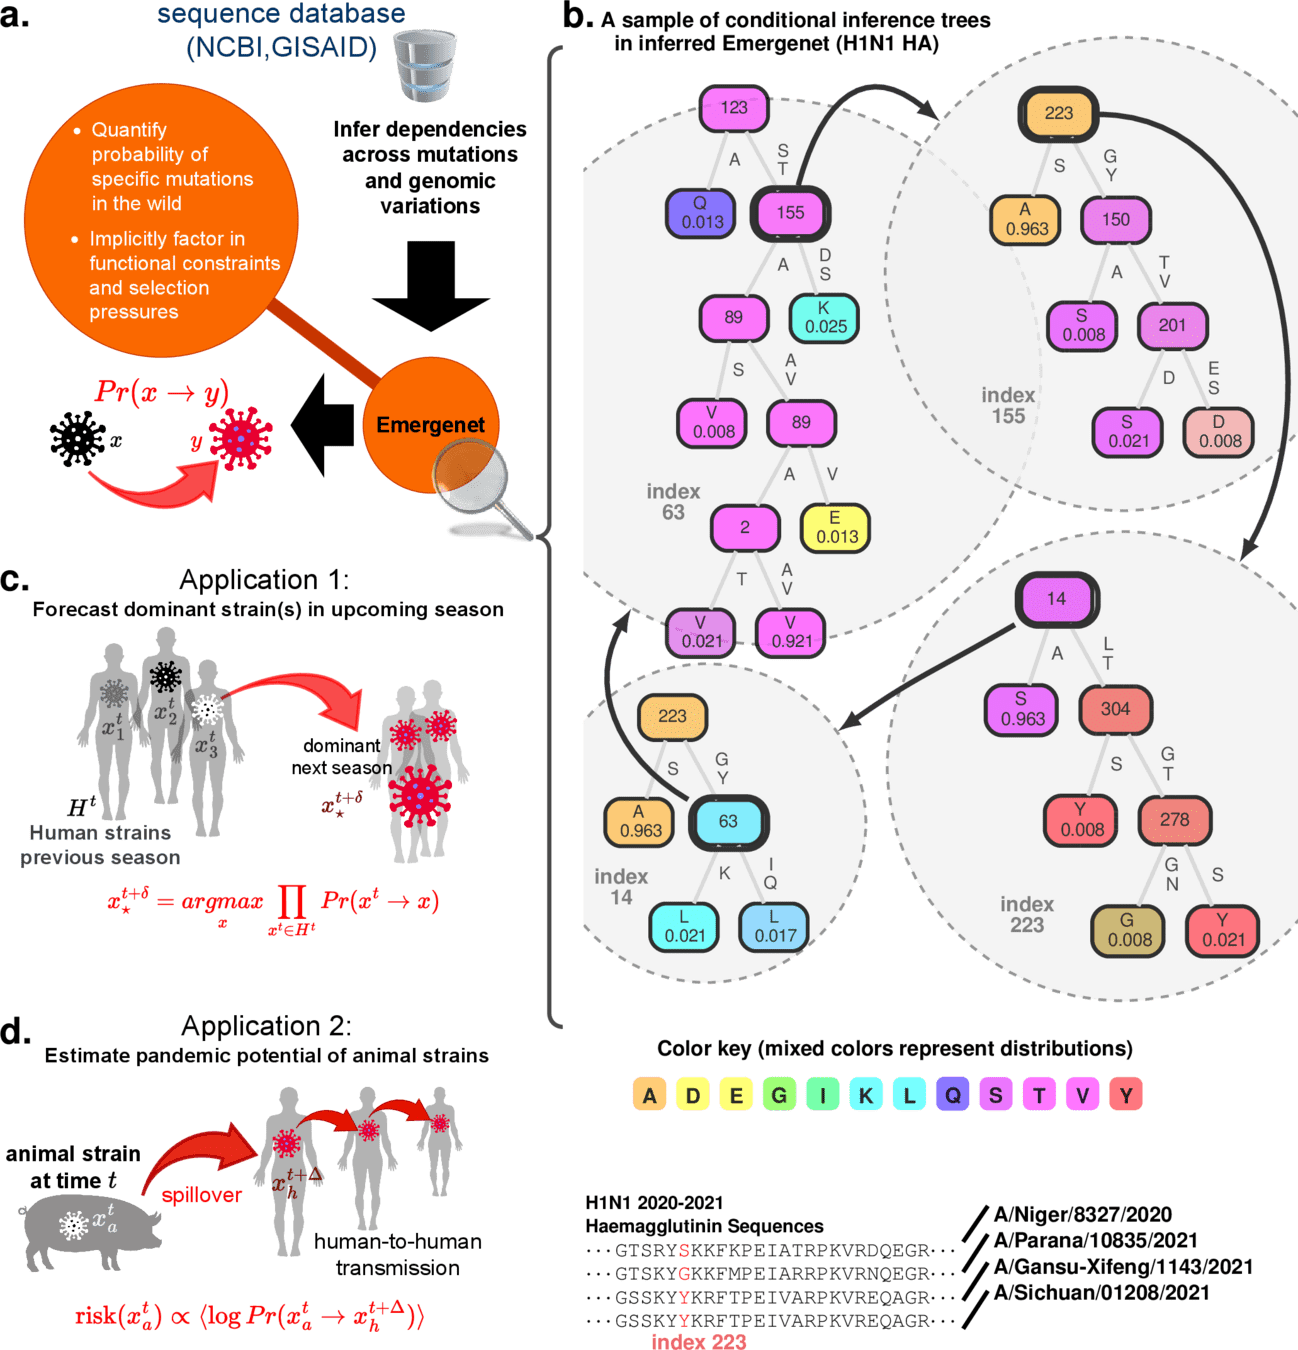
Revealing Emergent Cross-talk between mutations in a viral protein (Influenza A HA)
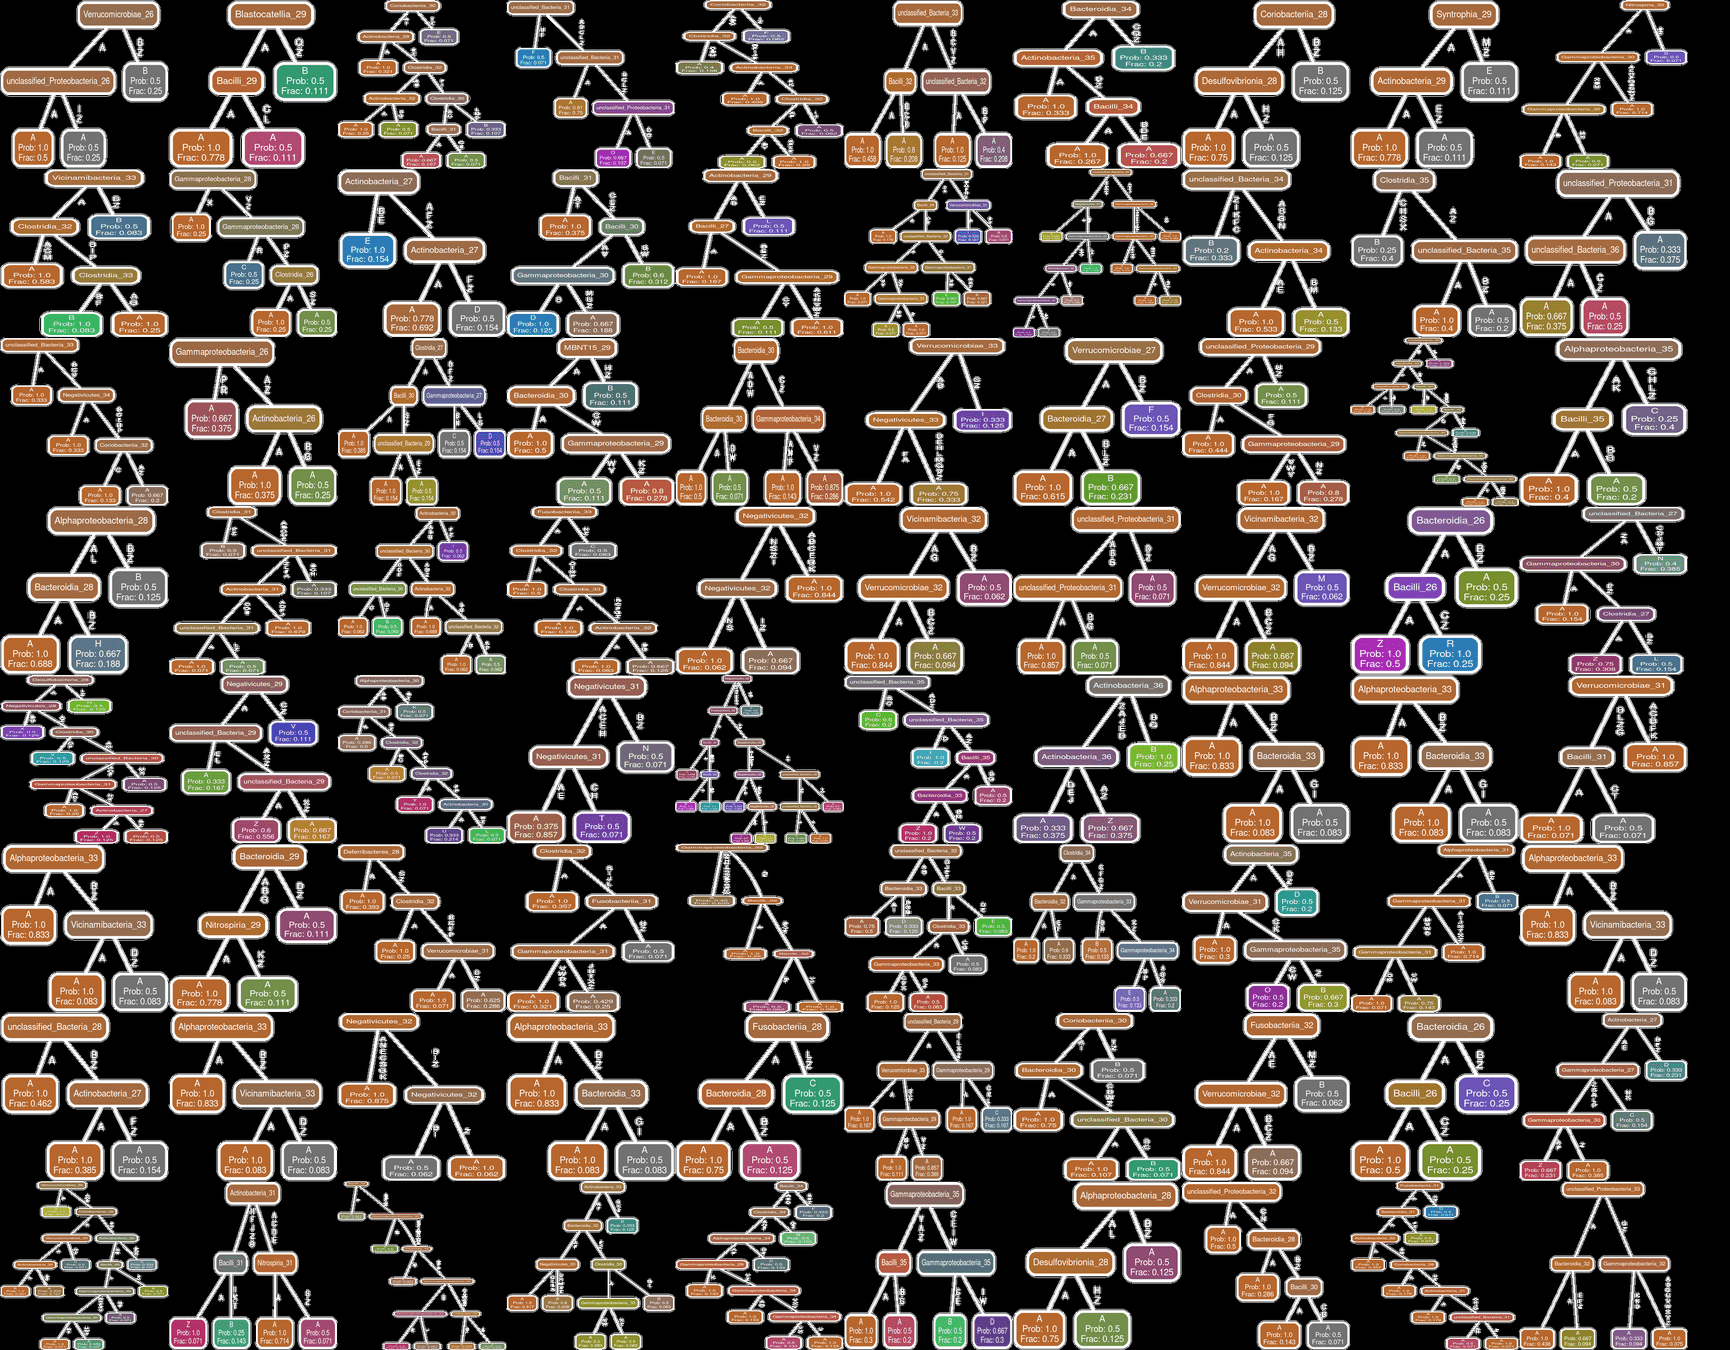
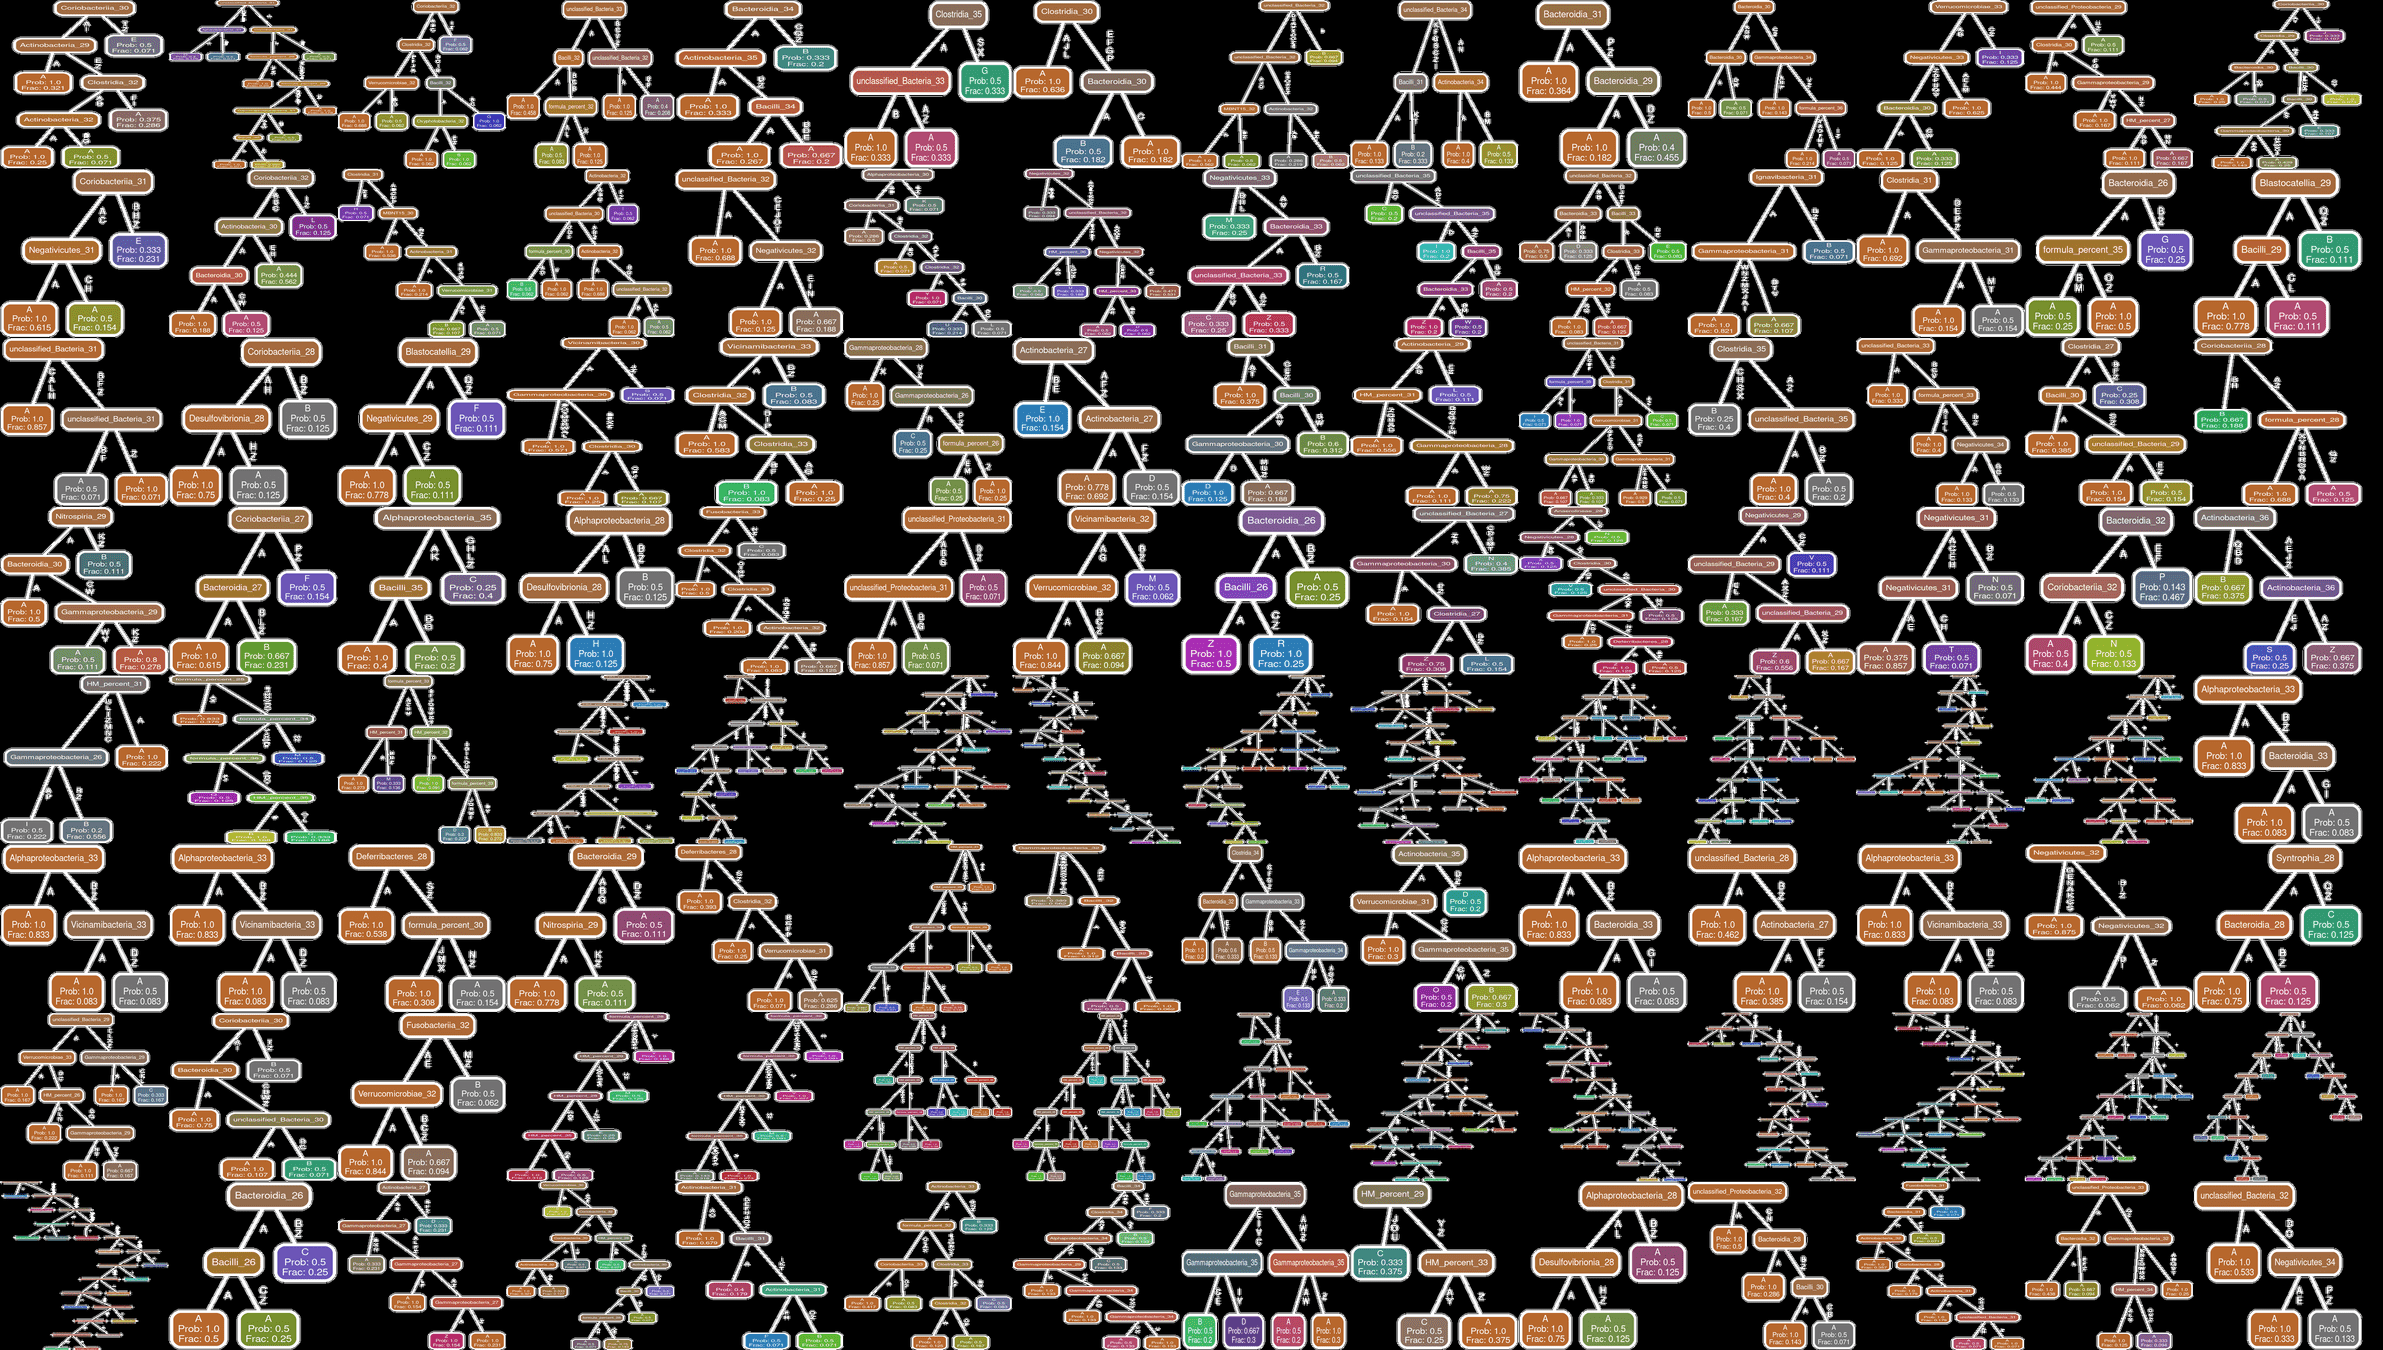
Component predictor (Conditional Inference Tree*)
Example: Influenza A HA protein
H3N2 2021 Influenza A HA
H5N1 2013 Influenza A HA
Influenza C HEF
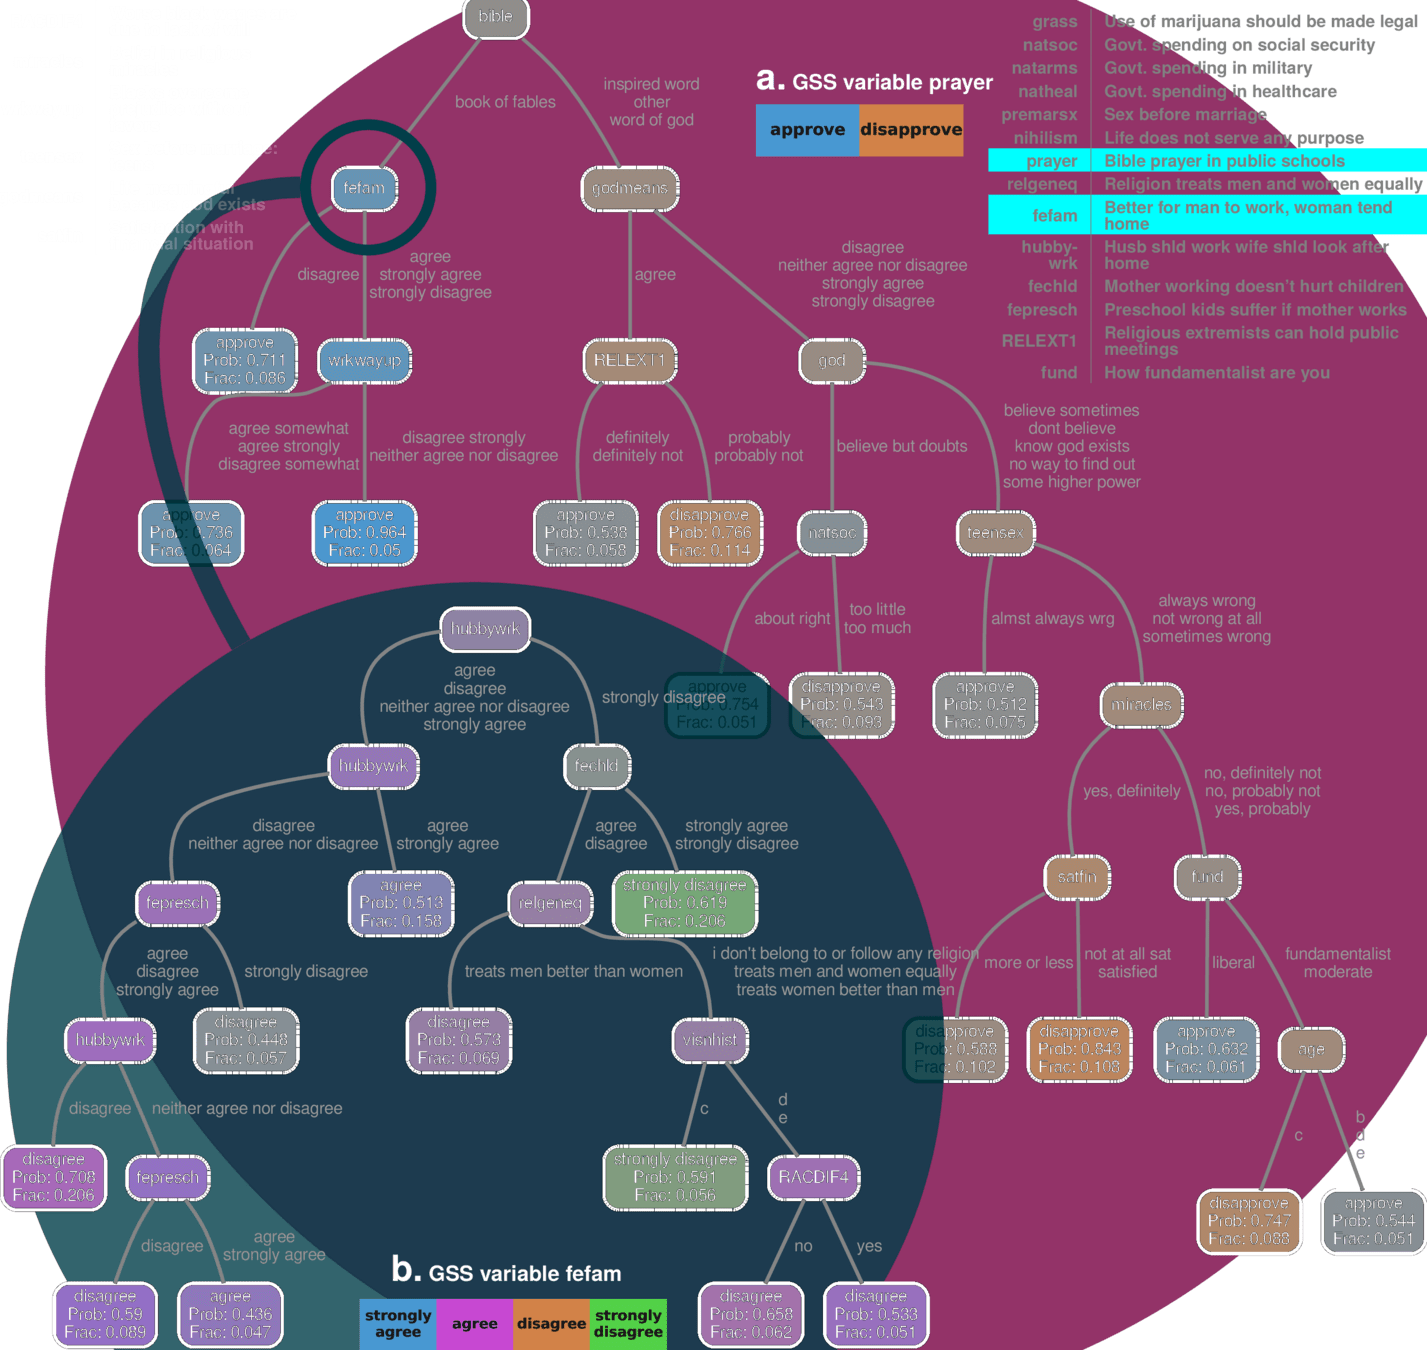
GSS 2018 dataset
/unpopular opinion
A decade of 16S rRNA studies—pumping out "diversity indices" and entropy curves—has failed to deliver biological insight.
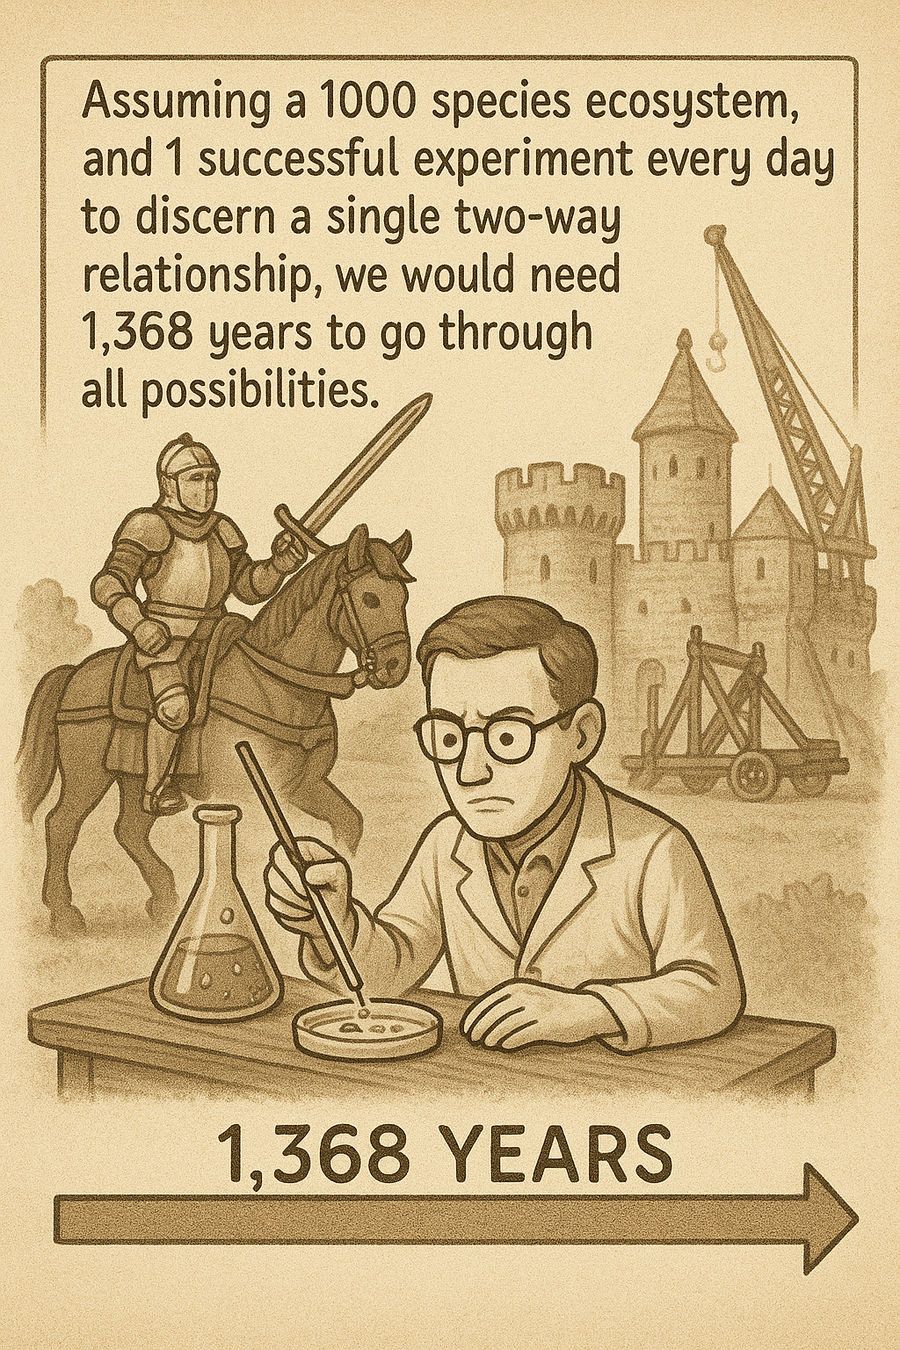
We need new methods to model and understand complex systems
| species A | speciesB | species C | --- | species n | |
|---|---|---|---|---|---|
| Person 1 | |||||
| Person 2 | |||||
| --- | |||||
| Person m |
observables
samples
Distributions over alphabet \(\Sigma^i\)
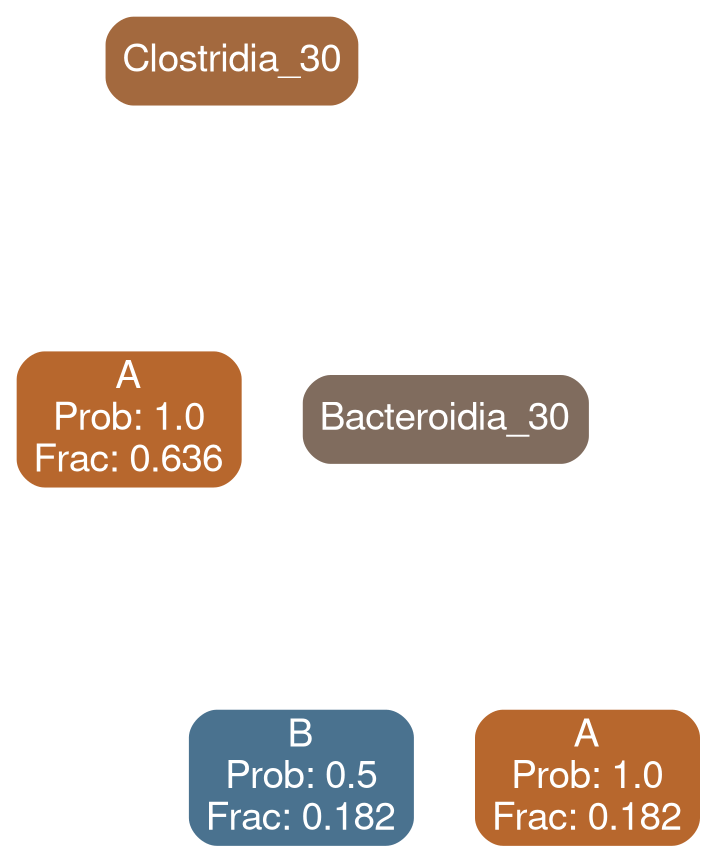
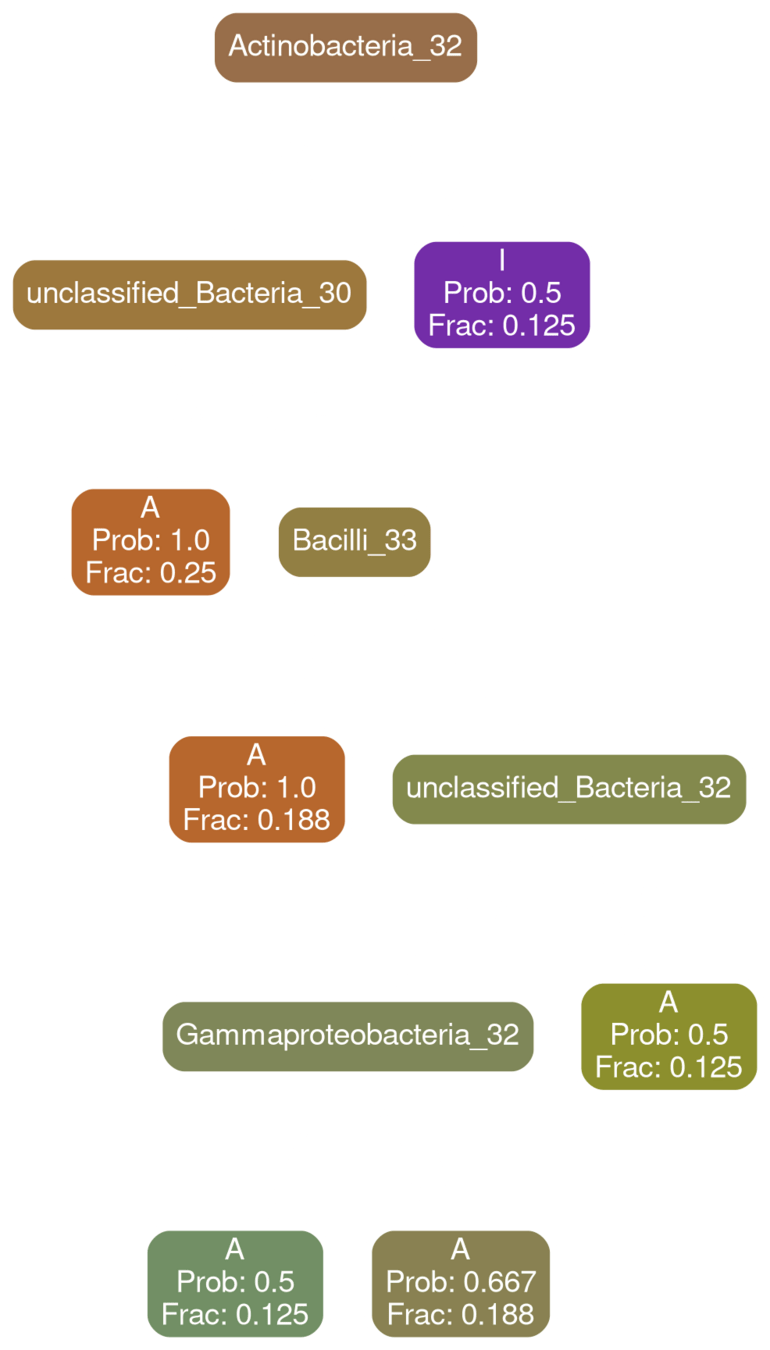
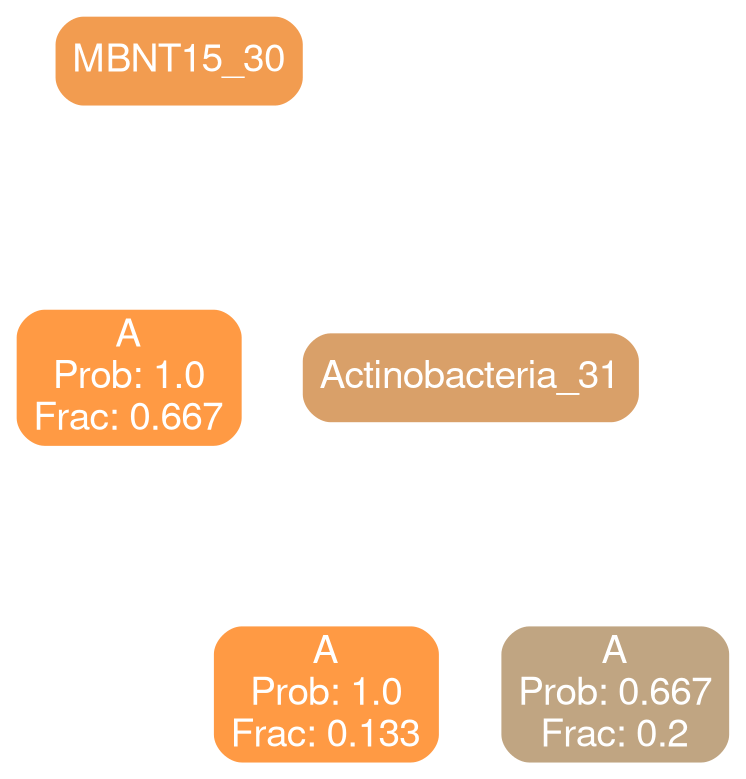
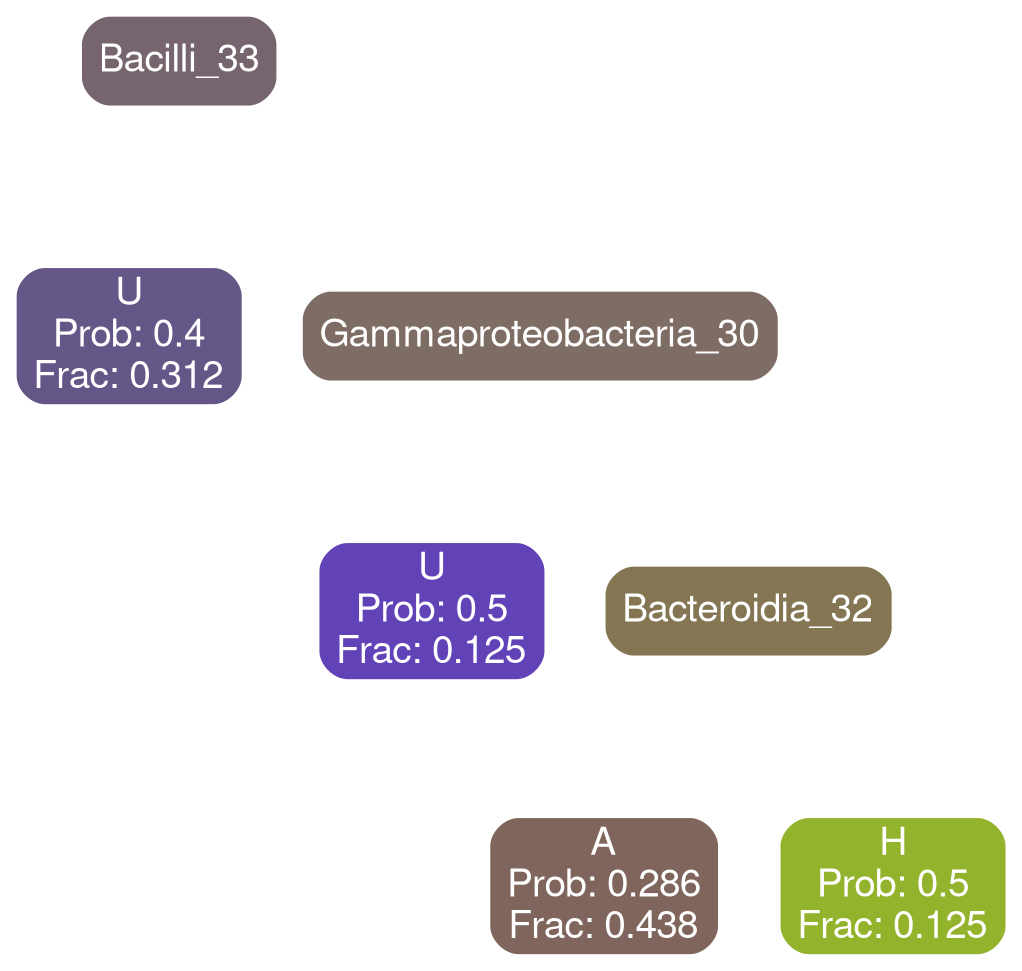
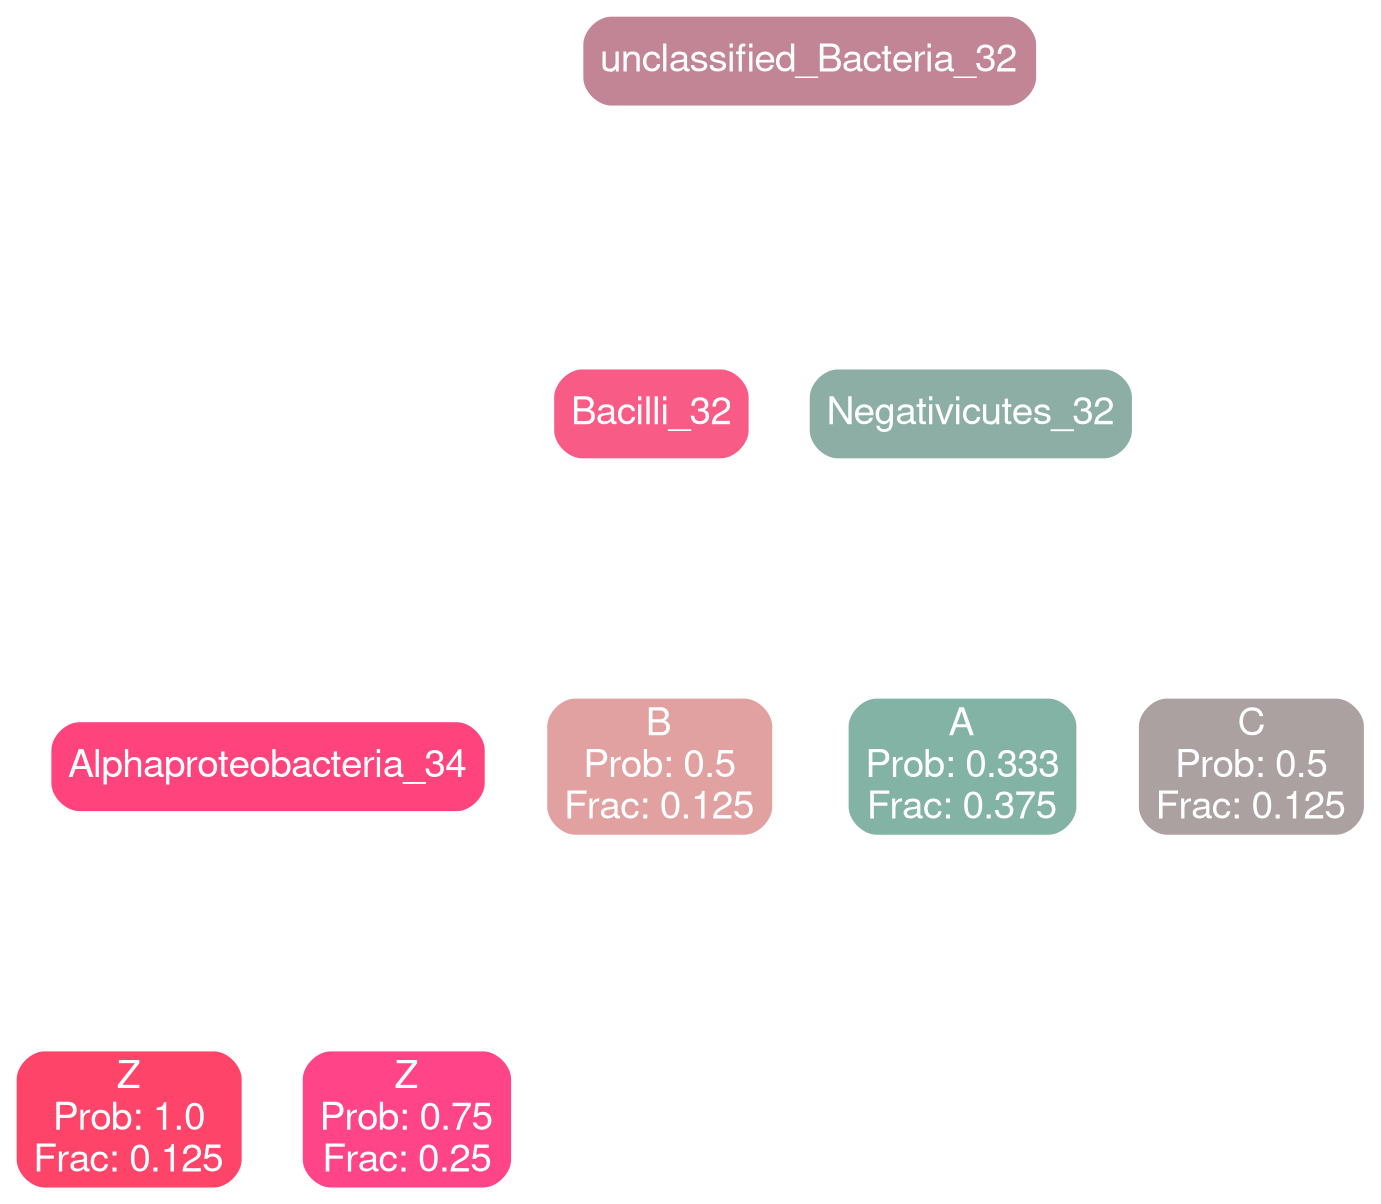
Individual Predictor (CIT)
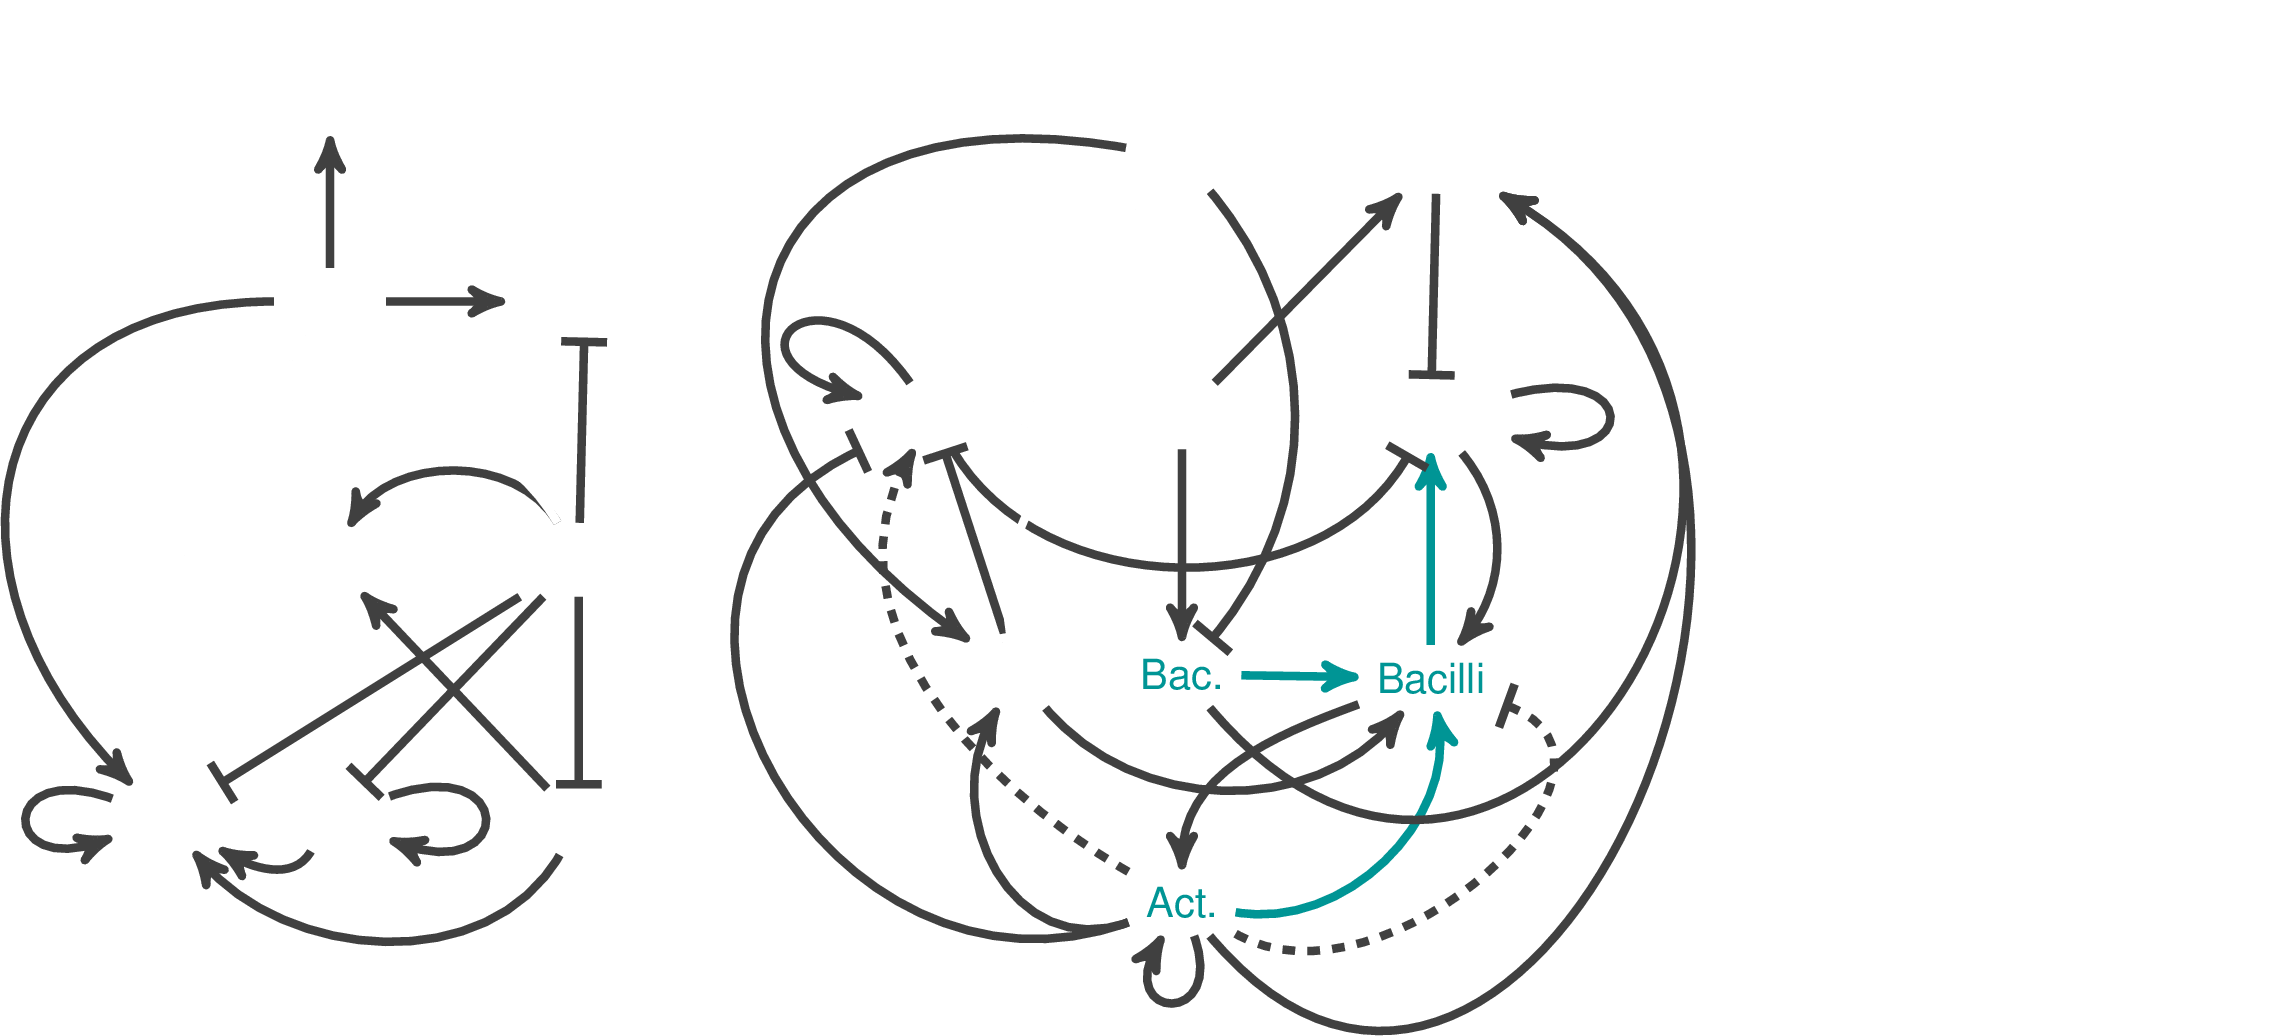
cross-talk
Tension between predicted and observed distribution drives change
\(\psi^i\)
| very high | high | average | low | very low |
\(\phi\) estimates \(\psi\)
Examples: GSS, ANES, WVS, ESS, Eurobarometer, Afrobarometer, Asian Barometer etc
Bacteriodota
individual
estimate is always a non-empty non-degenerate distribution
missing observation
can also be time-varying
Hundreds of thousands to 10s of millions of features
The Goal: Create a digital twin which can reveal valid perturbations
where \(D_{JS}(P\vert \vert Q)\) is the Jensen-Shannon divergence.
This bound connects ``closeness'' of samples to the odds of perturbing from one to the other, bridging geometry to dynamics
(Sanov's Theorem, Pinkser's Inequality)
\(\psi\)
\(\psi'\)
\(\theta\)
"spatial average": average of all plausible worldviews or states
* Sizemore, Nicholas, Kaitlyn Oliphant, Ruolin Zheng, Camilia R. Martin, Erika C. Claud, and Ishanu Chattopadhyay. "A digital twin of the infant microbiome to predict neurodevelopmental deficits." Science Advances 10, no. 15 (2024): eadj0400. https://www.science.org/doi/full/10.1126/sciadv.adj0400
persistence probability
Central to Model Drift Quantification
Start with opinion vector with all entries missing
This is a standard Physics construct, quantifying curvature of the underlying latent geometry
Easily computable in LSM framework!
Apply \(\phi^i\)
Random variable quantifying dispersion around the spatial average of worlviews
const. scaling as \(N^2\)
Completely uninformative state
Observed state
?
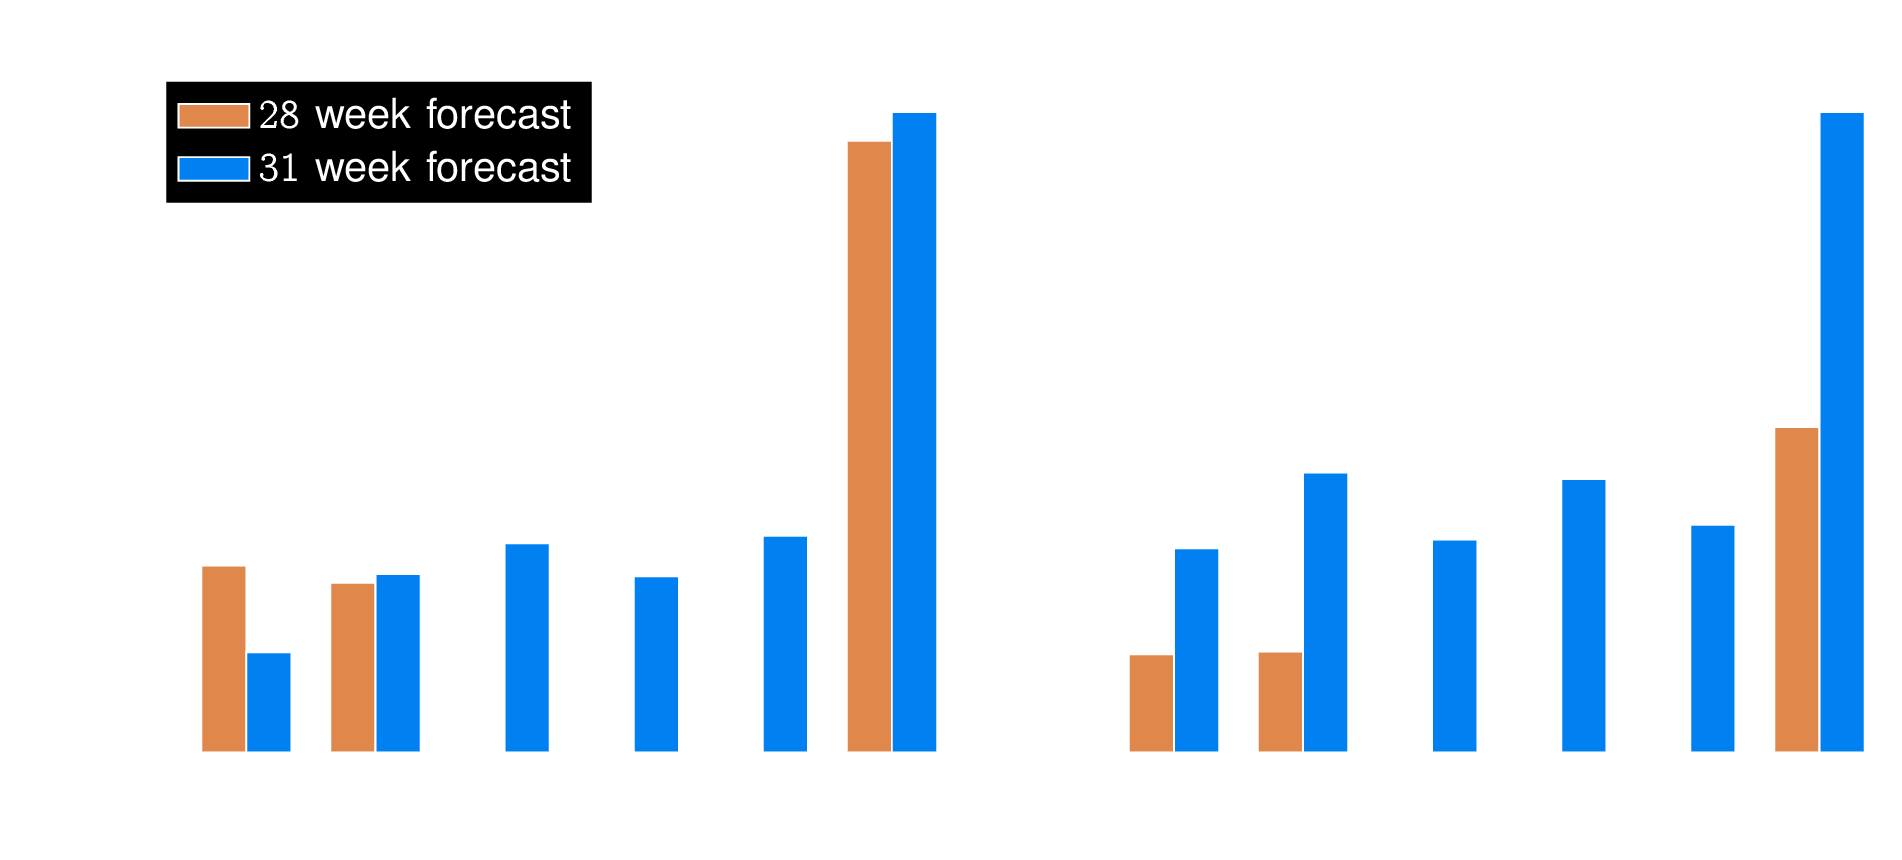
Bacilli 30
typical
deficit
Coriobacteria 32
typical
deficit
Gammaproteobacteria 32
typical
deficit
All Patients
Feeding Variables added
Building classifier based on LSM metric
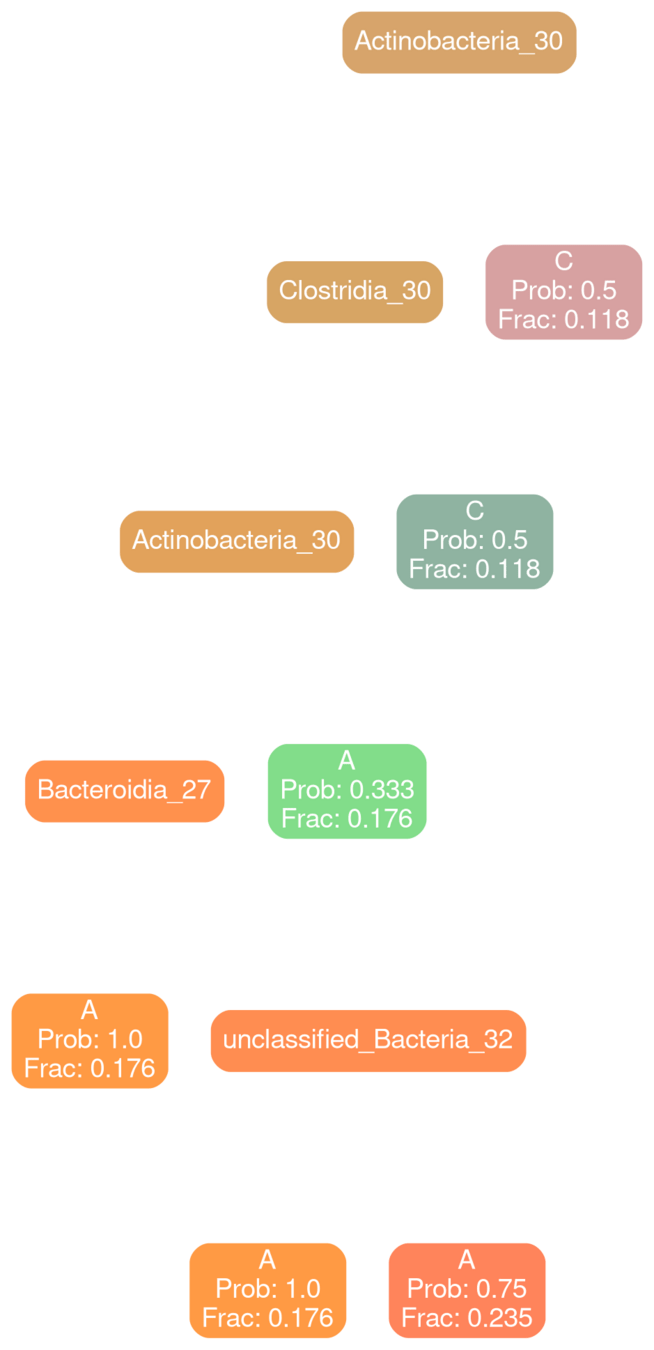
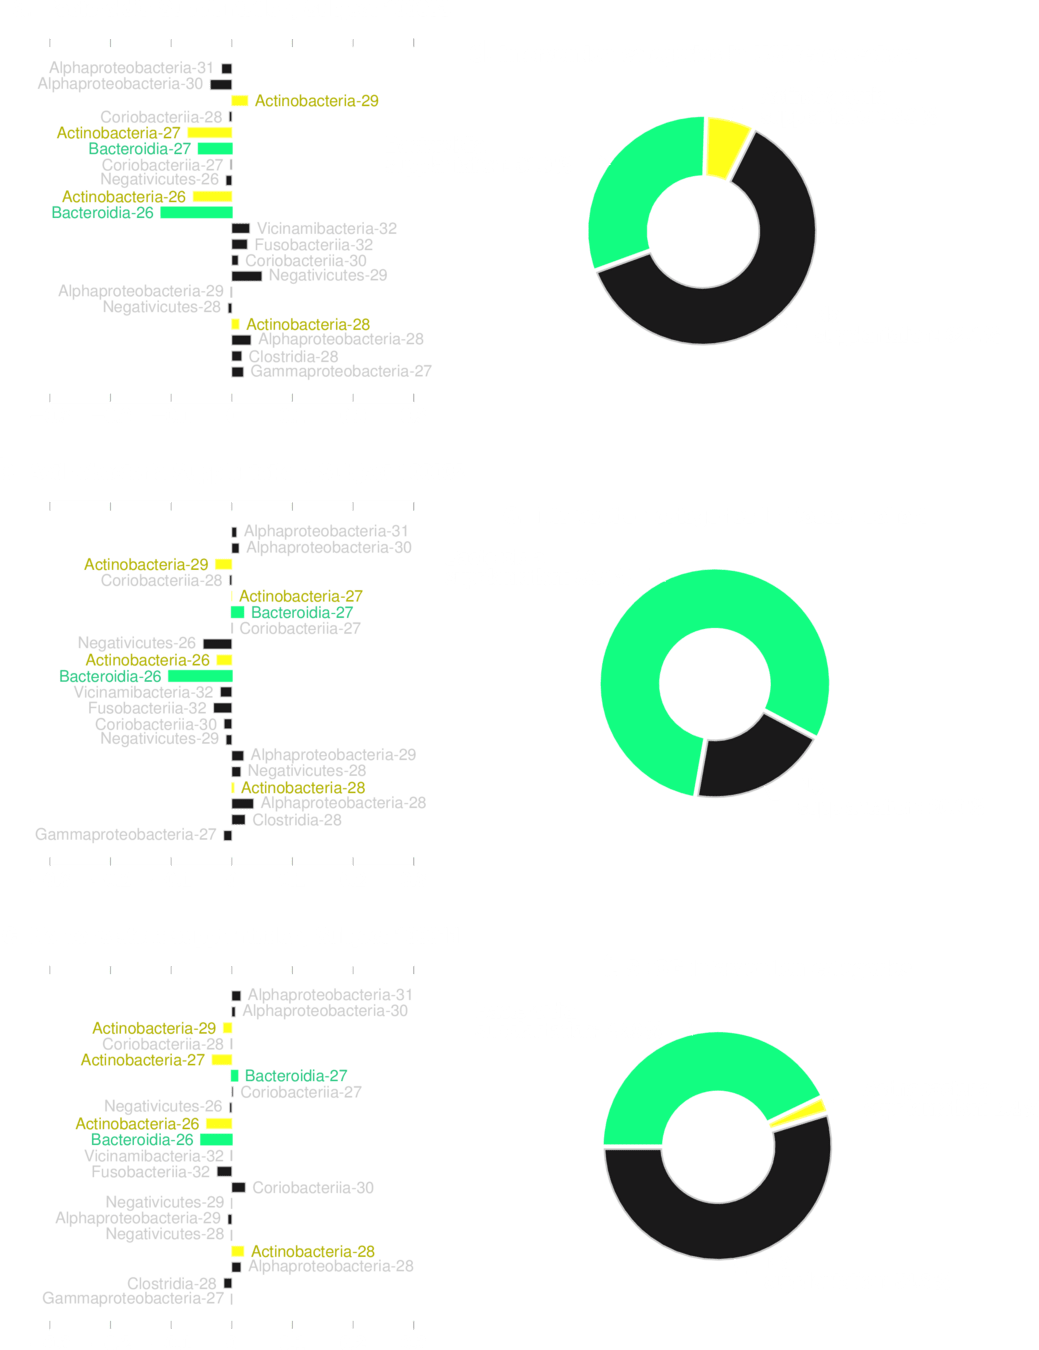
No! Our results indicate that supplantations need to be patient specific
No transplantation is guaranteed to work reliably
Predicted to reduce
risk reliably
Predicted to reduce
risk reliably
Supplantation MUST be bacteroidia
Supplantation MUST be Actinobacteria
No risk-decreasing supplantation
Typical
Deficit
Future
Answer the question: "what is a healthy microbiome?"
Explicit supplantation profiles that are tuned to individual ecosystems
Dataset from Metabolomics Workbench
| Study ID | ST000923 |
|---|---|
| Study Title | Longitudinal Metabolomics of the Human Microbiome in Inflammatory Bowel Disease |
| Institute | Broad Institute of MIT and Harvard |
|---|---|
| Last Name | Avila-Pacheco |
| First Name | Julian |
| Submit Date | 2017-11-14 |
| Num Groups | 3 |
| Total Subjects | 546 |
| Num Males | 276 |
| Num Females | 270 |
| Analysis Type Detail | LC-MS |
State-of-art microbiome based Classification (~10 species) *
| IBD vs UC | 0.82 |
| IBD vs CD | 0.76 |
*Zheng, J., et al. (2024). Noninvasive, microbiome-based diagnosis of inflammatory bowel disease. Nature Medicine, 30(12), 3555–3567. https://doi.org/10.1038/s41591-024-03280-4
| IBD vs non IBD | 0.85 |
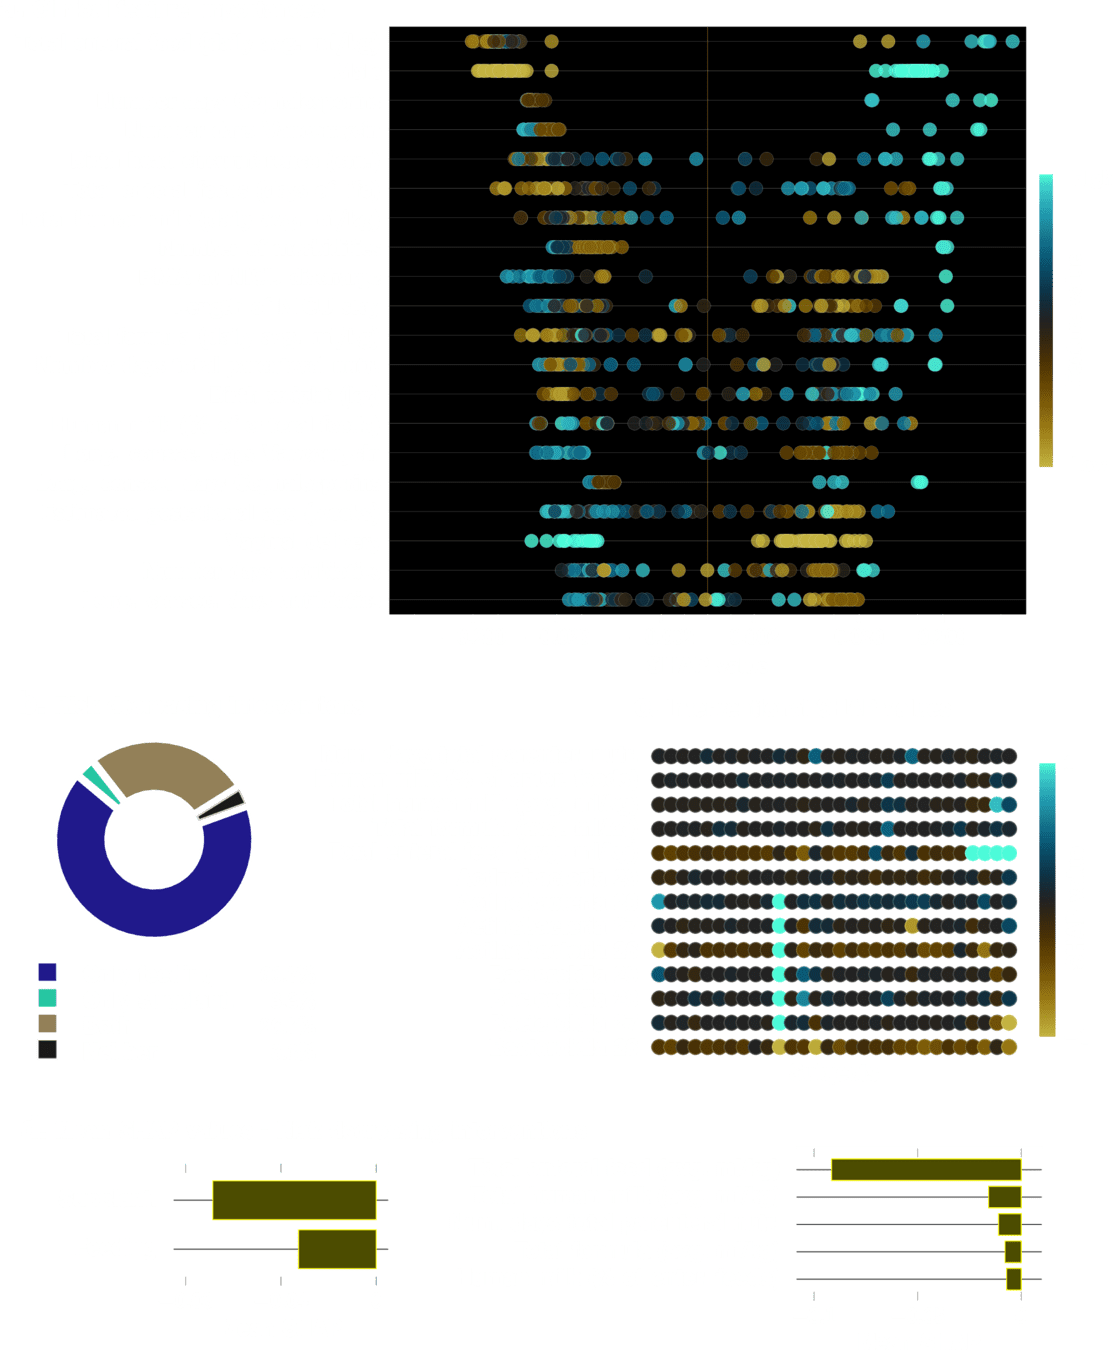
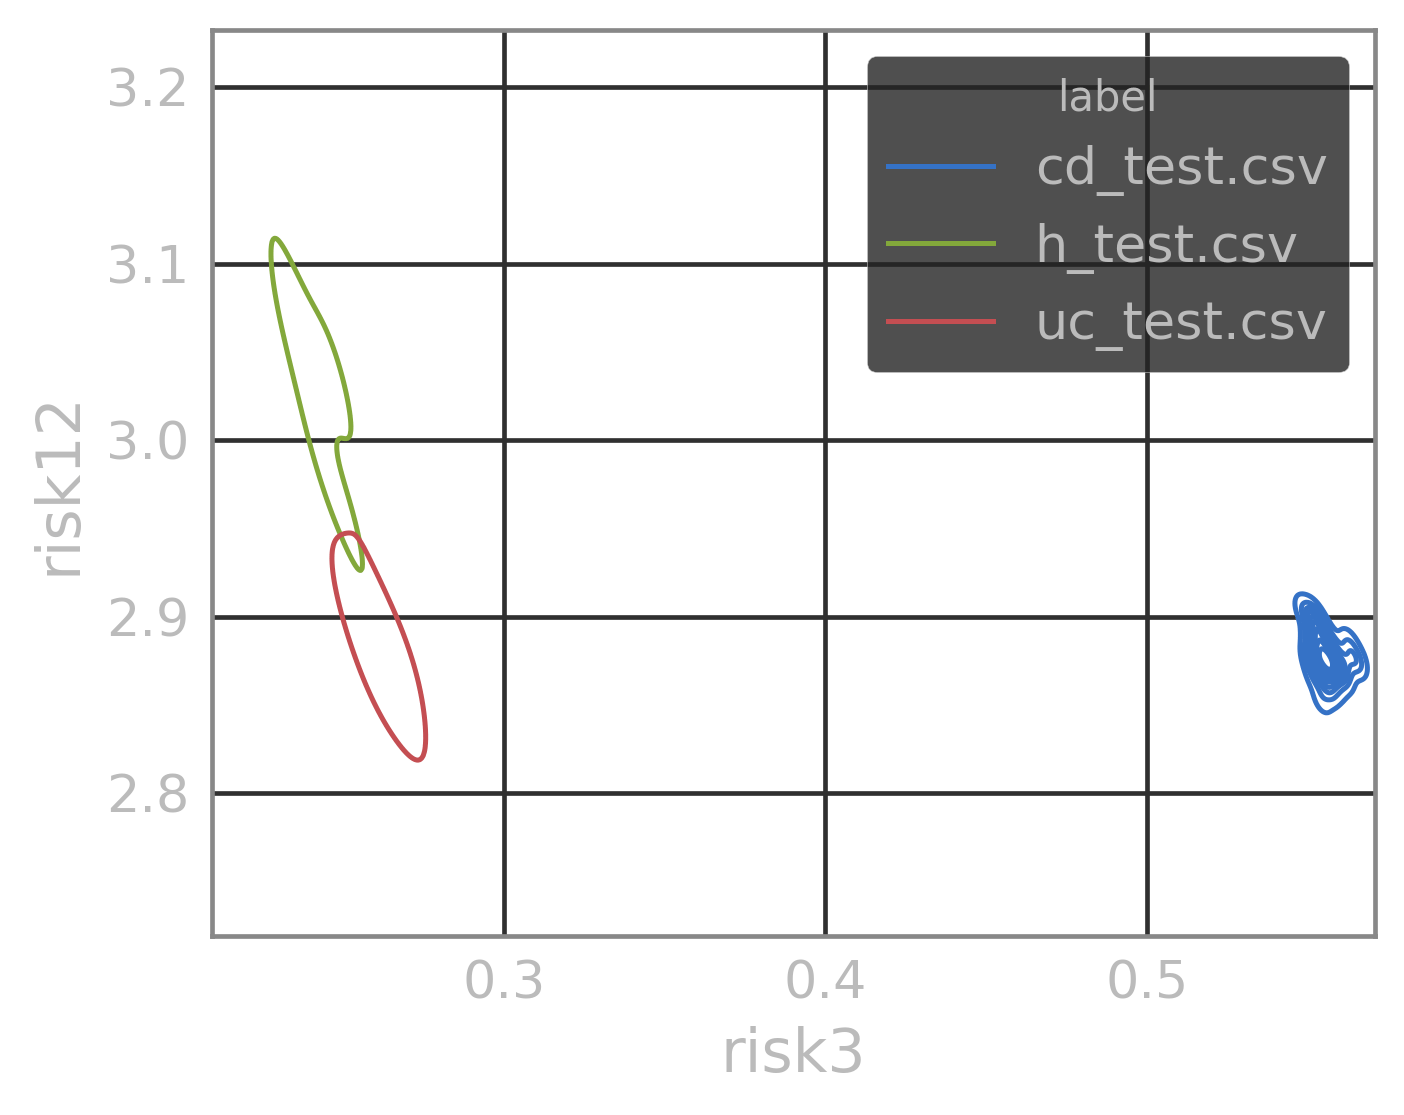
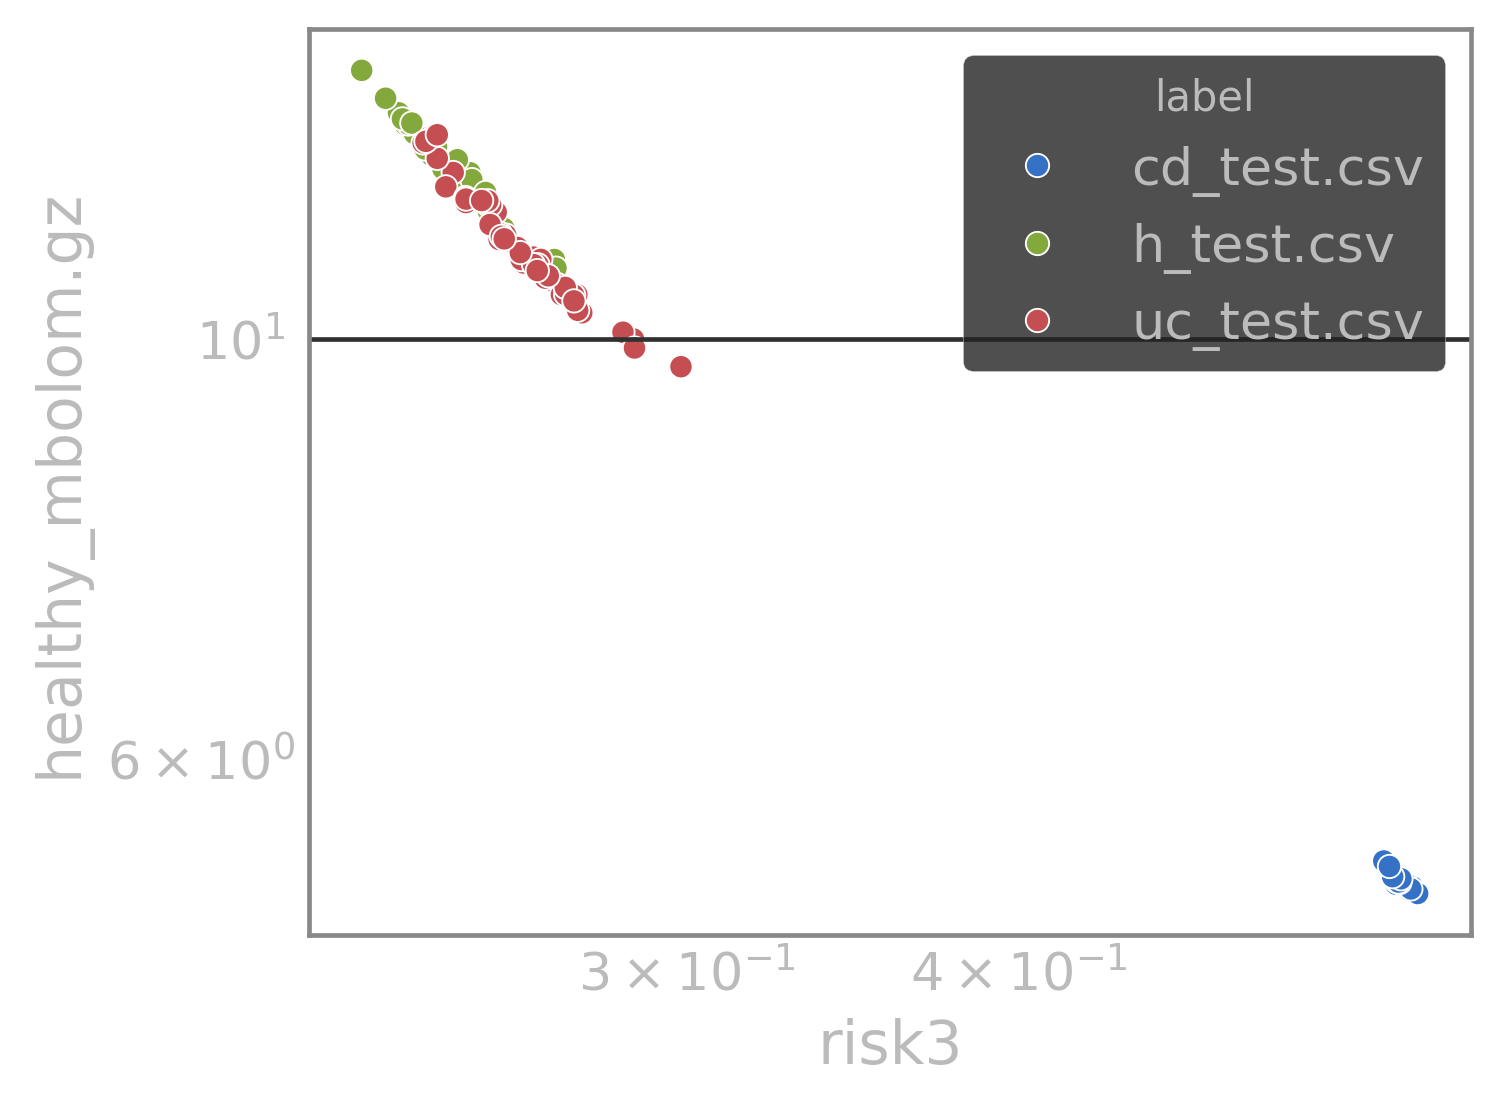
Gut-Metabolome based Classification (~36 metabolites) *
Non-IBD metabolomic profile*
*Lloyd-Price J,et al.. Multi-omics of the gut microbial ecosystem in inflammatory bowel diseases. Nature. 2019 May;569(7758):655-662. doi: 10.1038/s41586-019-1237-9. Epub 2019 May 29. PMID: 31142855; PMCID: PMC6650278.
Ulcerative Collitis metabolomic profile
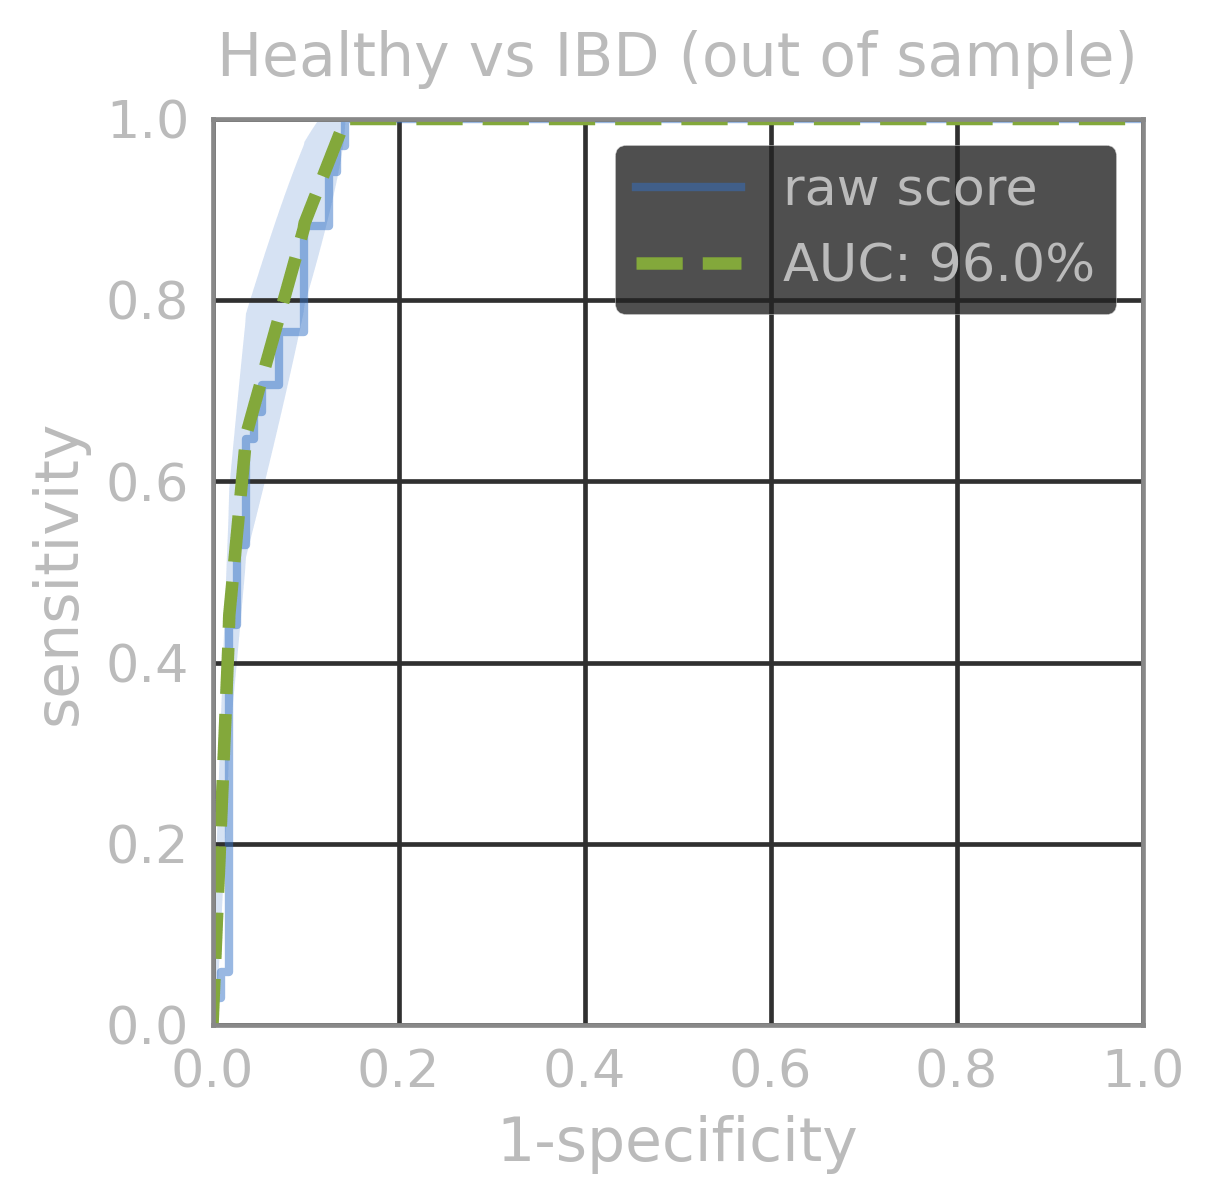
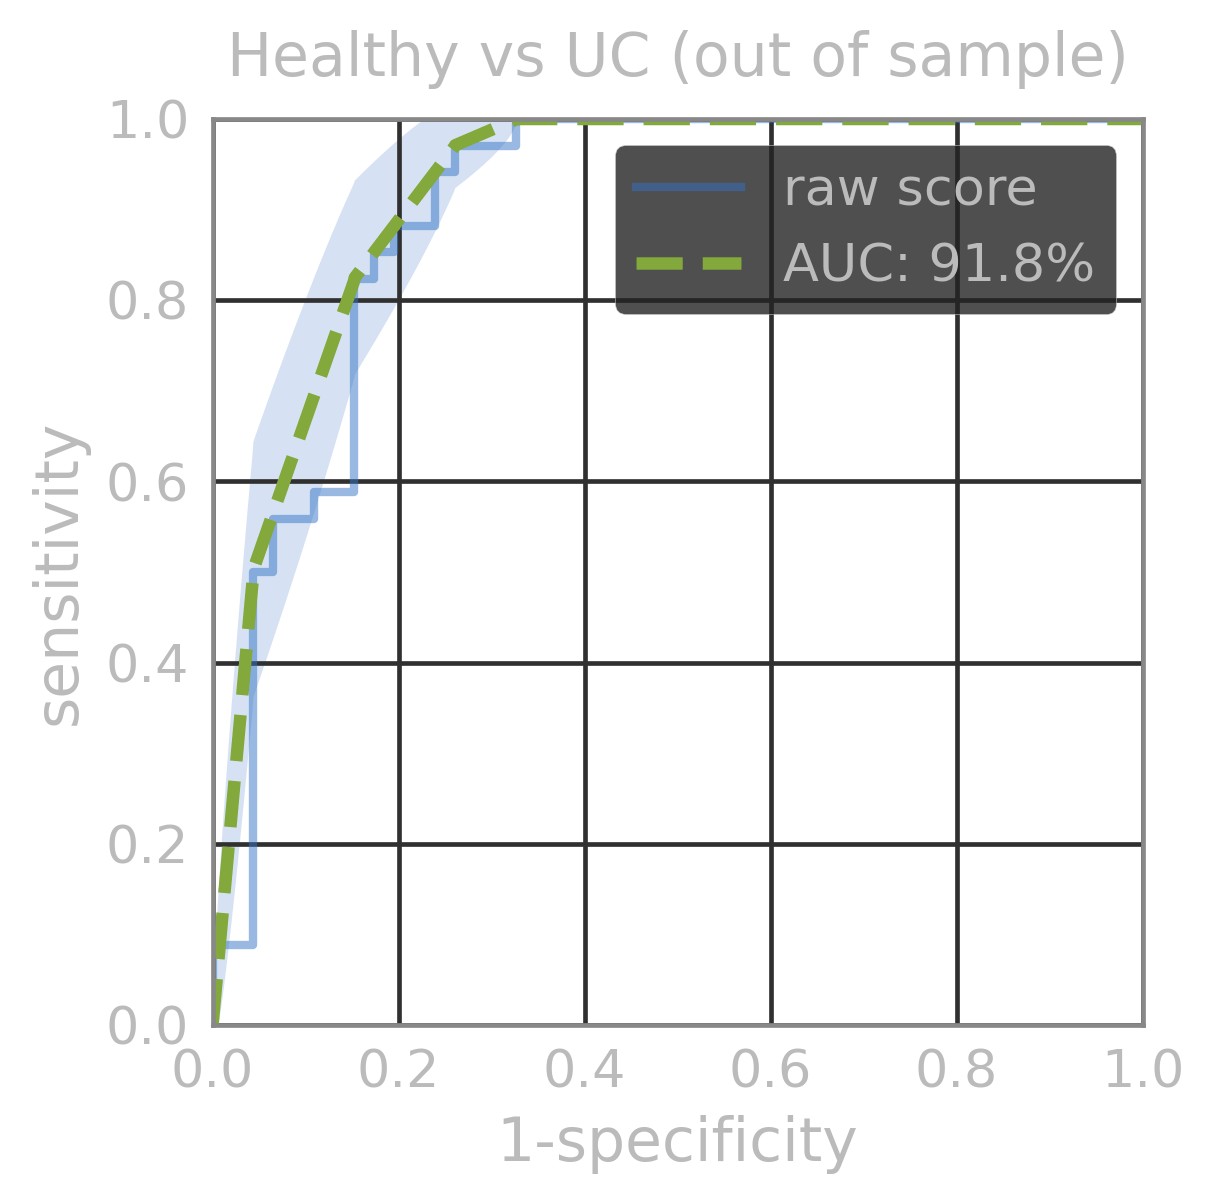
LSM model
| AUC (out of sample) | |
|---|---|
| Healthy vs IBD | 96.1% |
| Healthy vs UC | 92% |
| UC vs CD | 100% |
| Healthy vs CD | 100% |
LSM model
| AUC (out of sample) | |
|---|---|
| Healthy vs IBD | 96.1% |
| Healthy vs UC | 92% |
| UC vs CD | 100% |
| Healthy vs CD | 100% |
LSM model for healthy profiles
Any profile generated by \(\mathcal{H}\) is a healthy profile, while they might be different from one another
average healthy profile
ishanu_ch@uky.edu
https://slides.com/ishanu/lsm_biome
By Ishanu Chattopadhyay
Microbiome LSM


