Teaching Data Science when you're (merely) a mathematician
CC-BY James B. Wilson,
in collaboration with Emily King
Colorado State University
https://slides.com/jameswilson-3/math-archetypes/

CSU's Problem:
-
Students hungry to learn something "new".
-
Artificial Intelligence AI, Machine Learning ML, Data Science DSCI
-
-
Our teachers experienced in something "established".
-
Calculus, Linear Algebra, Analysis, Combinatorics, Algebra, Geometry, Topology, PDEs, Numerical Methods...
-
*New/Established are not always accurate labels.
Is it a real Problem?
-
70% of STEM majors leave STEM.
-
STEM Shortages caused by bad labor practices, not education gaps.
-
University responses to tech demands end up with expensive course redesigns and fickle student hiring.
-
Math at the top of "stable careers" along side "Business Management" and "Health Care".
[1] J. Skrentny, Wasted Education, Chicago Press, 2023
[2] BLS Employee Tenure Table (January 2024)
Who else?

Why Me?


Me pre-pandemic:
What do we teach?
Me in-pandemic:
Who do we teach?
Me post-pandemic:
Who teaches who we teach?
\begin{bmatrix} I & O \\ L & A \end{bmatrix}
Data Science Curriculum
2/3 student,
1/3 teacher,
development
Archetypes as a way to reach student and teacher
A "Jungian" Archetype is a pattern told through symbols & story.
Carl Jung's definition is vague and changing. The term is now part of modern psychology, see [1]. My pithy approximation will do for this talk.
[3] F. Fordham, Jung: An introduction to His Psychology, Howes Ltd, 2024.
... If it's about who teaches and who we teach
....then its part psychology?
Arrow drawing haven't changed much since the caves.
... is this "scientific" enough for a math classroom?
Stories sure hang around a long time while also being reinvented to great acclaim.


Jung's theory in Teaching
-
"Intuition": connection to shared experiences.
-
Archetypes: a means to pass on intuition.
-
How does this matter? Archetypes recycle themes; hence, sparse data has outsized impact.
[4] Clifford Mayes, Jung and Education, Rowman & Littlefield 2005
Jungian theory in Teaching:
Use Pre-packaged Themes/Characters: "The wise sage", "The Hero", "The Trickster", "The Persona"...
Lean on Symbolism / Imagery / Sounds / ...
Generic is ok "Once upon a time..." gives license to imagine
And if you feel weird using stories in Science SO DOES EVERYONE (but it still works...) [5]
[4] Clifford Mayes, Jung and Education, Rowman & Littlefield 2005
[5] C. Bartlett, Where is the storytelling in science?, Proc. U. Cape Breton 1st Annual Storytelling Symposium, 1997
Some example Archetypes for Data Science Linear Algebra
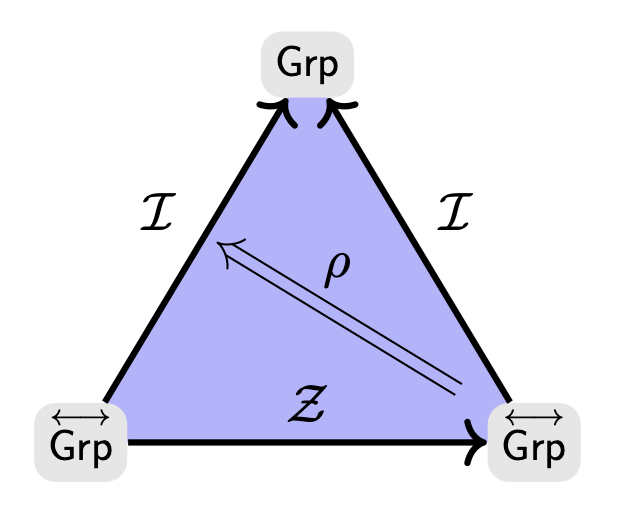
Data: what we can measure or calculate.
Information: subset of data that answers a question.
Data Science: turning data into information

What is Data Science?
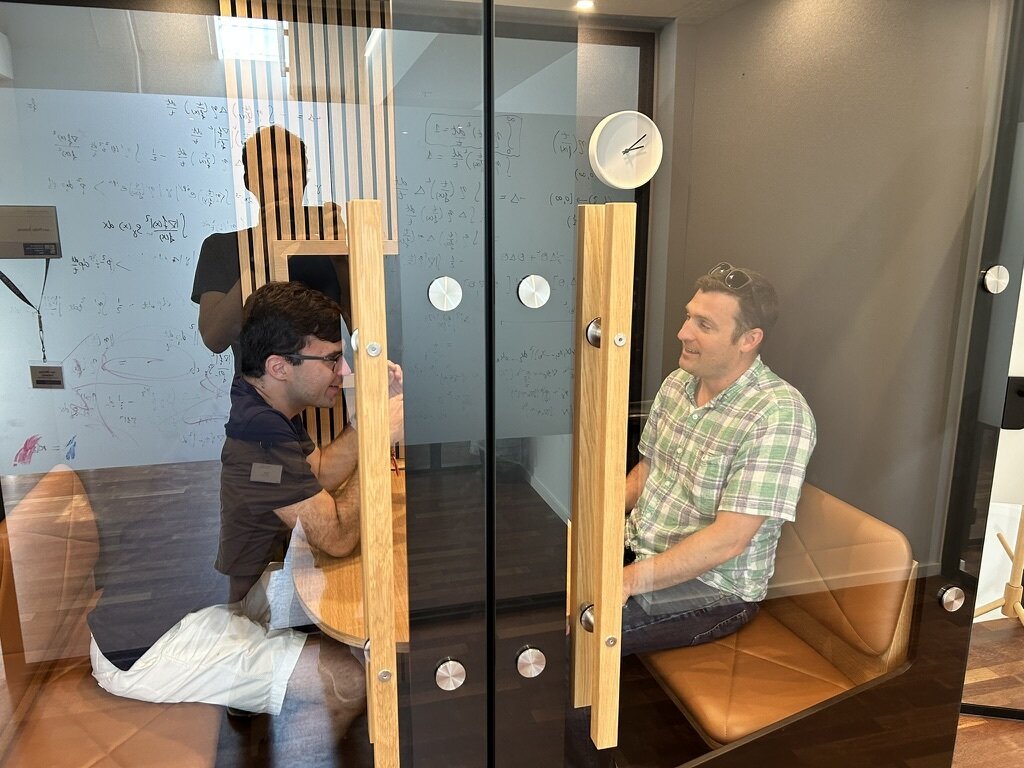
Lineum looks at a clock and notices
- the fonts, ....
- the pole, colors, style, hands, the ticking sound, manufacturer...
Is he late for the bus?
- Hands!
What is Data Science?
Now the clock by itself stands as an enduring symbol of this lesson.
What is Linear Data?
Symbol of (non)Linear Data.
-
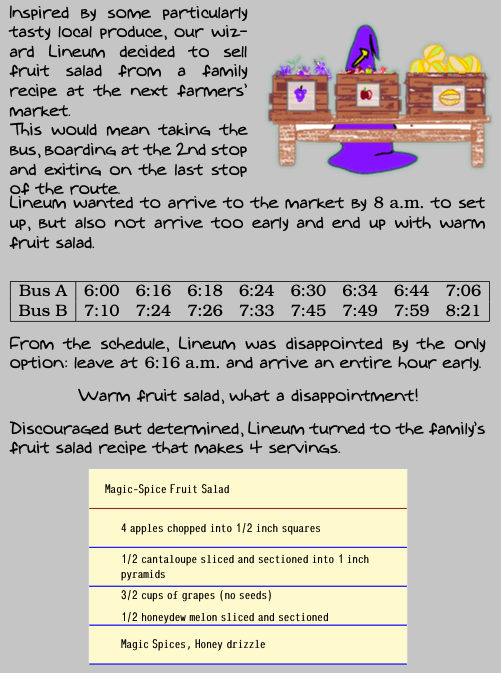
Bus schedules? Non-linear because combinations aren't informative for travel.
-
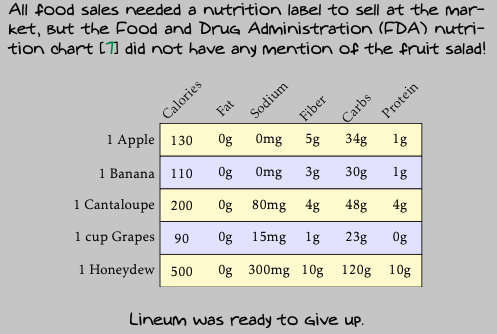
Nutrition Label? Linear because combinations are informative for meals.
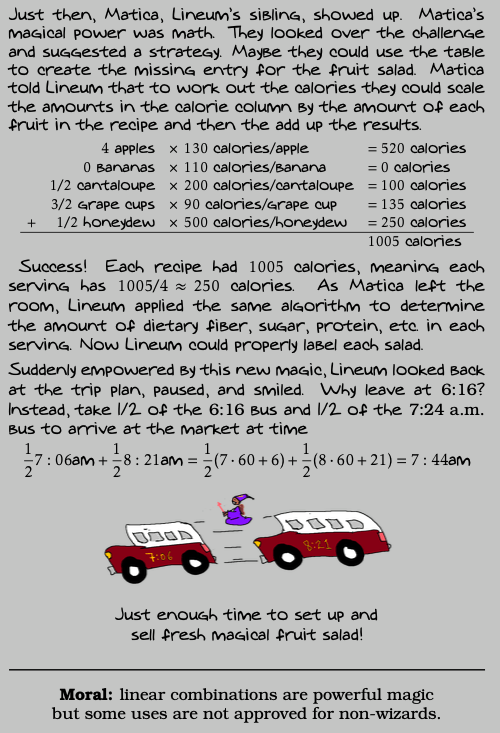
A Data Problem is "Linear" when weighted (linear) combinations are informative.
-
Is a list of credit cards numbers a source of Linear Data problems?
-
A list of student grades?
-
Any come to your mind now?
Now hit them with a heuristic
-
Is the average "informative"?
-
Then possibly linear.

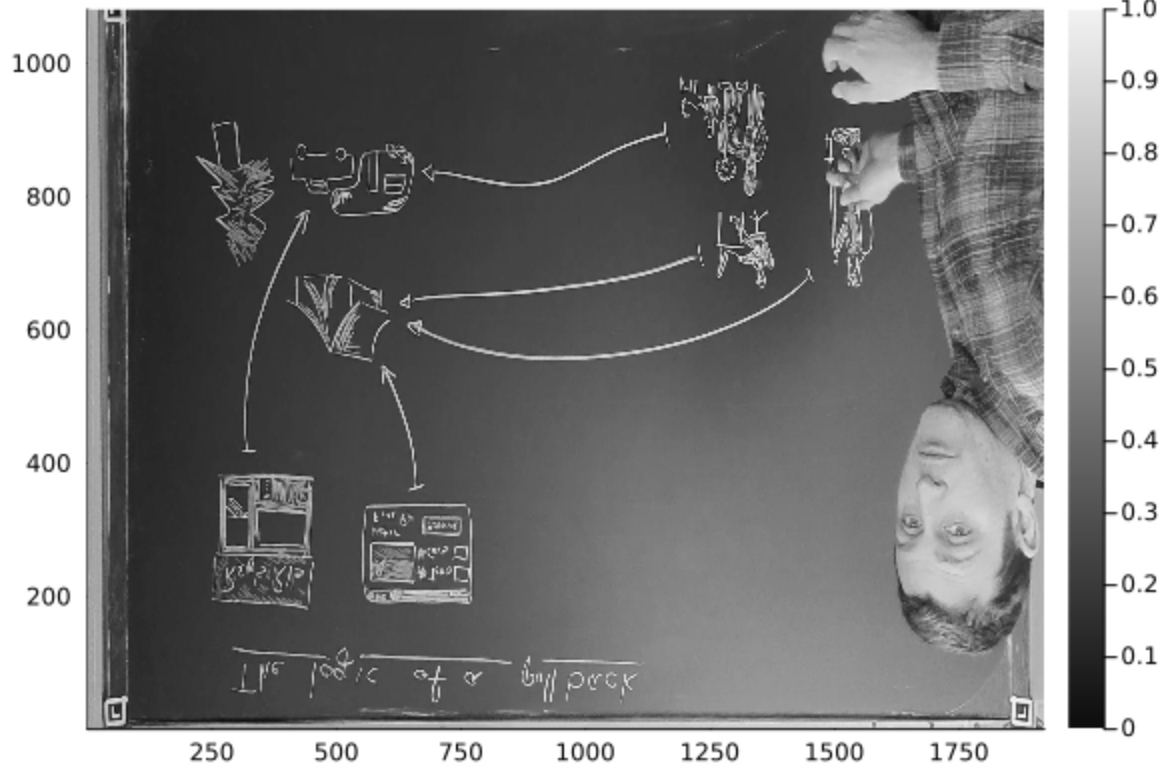
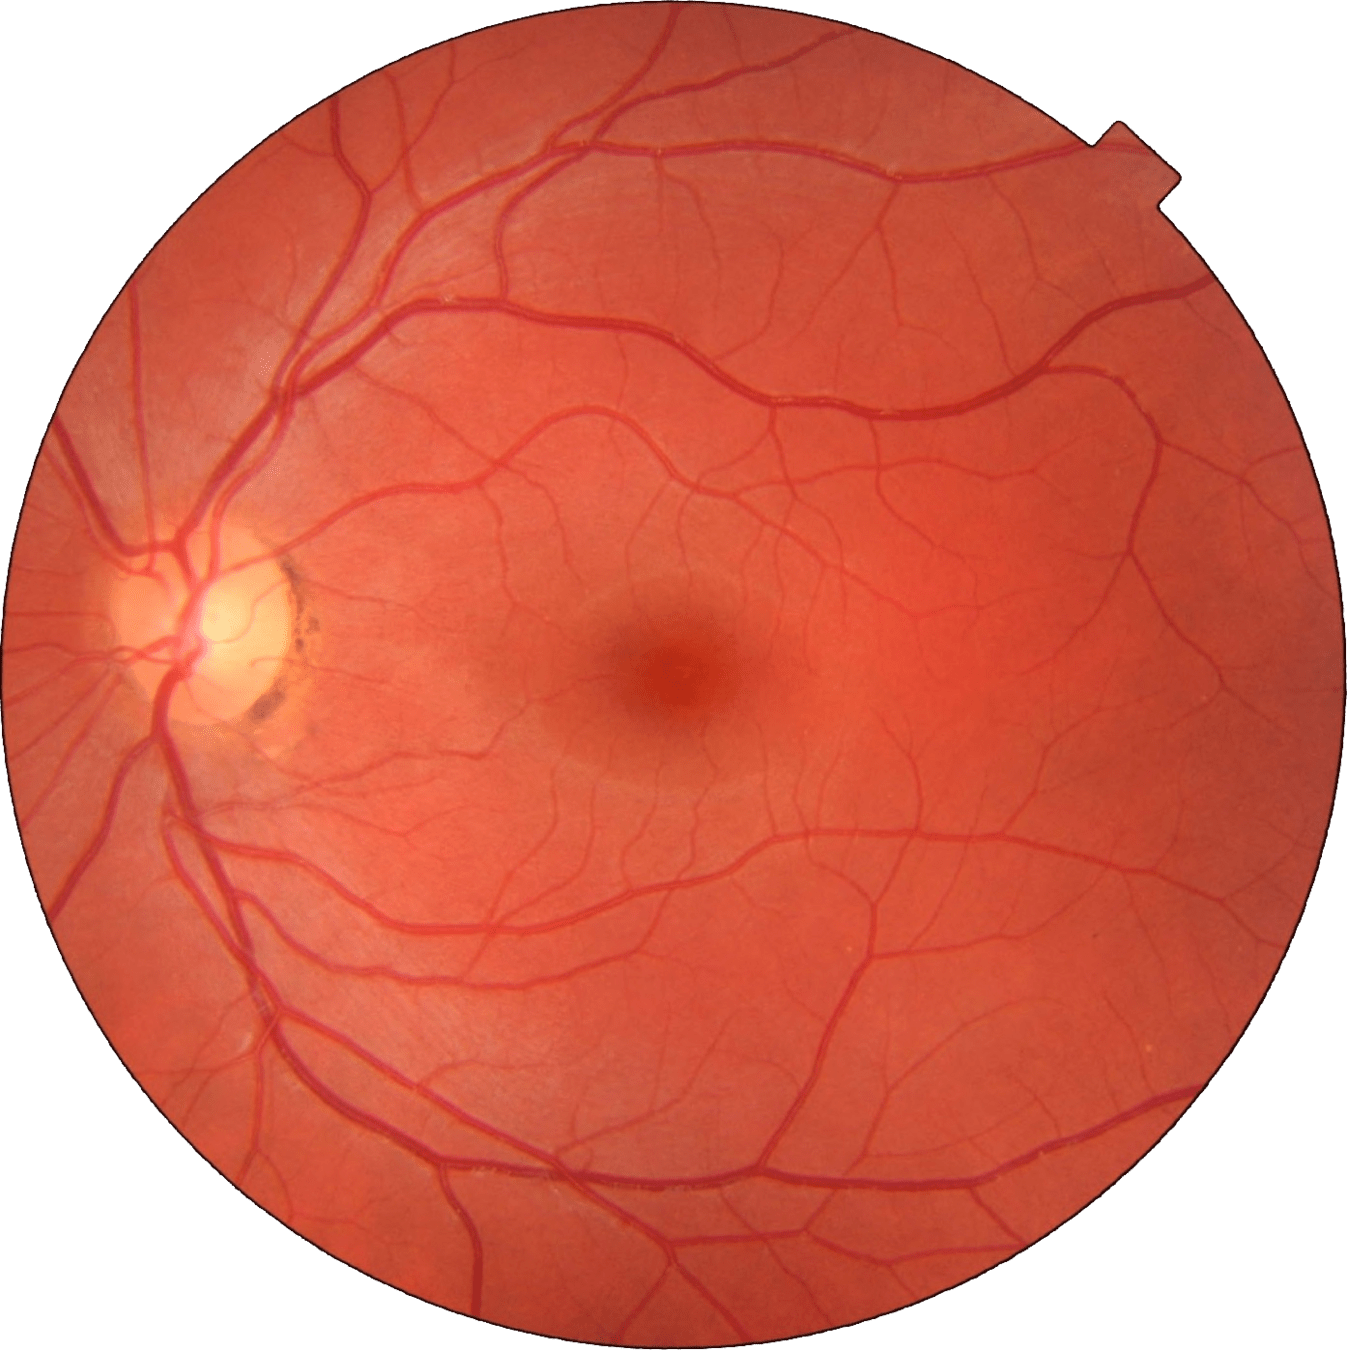
A gray-scale image is a matrix of numbers. Is it a source of Linear Data Problems?

Scared Objects?
Here is the average row of my image...
This is the image
A case study in Creating archetypes
Goal:
Explain when to use the SVD.

Common Option : Do Applications
E.g.: Image compression
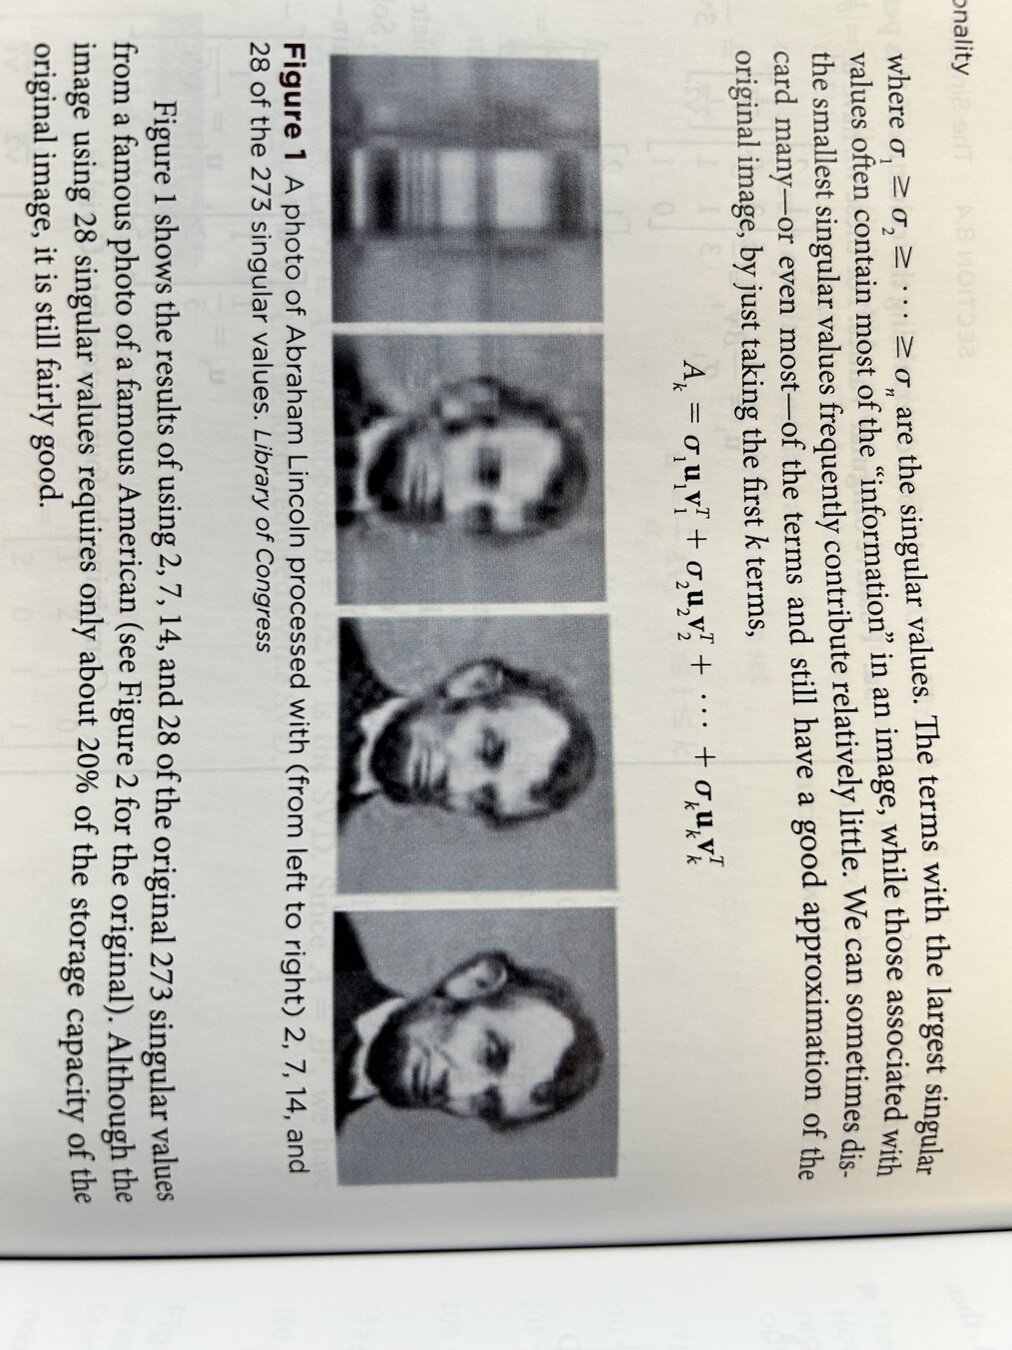
Holt, Linear Algebra with Applications, 2nd Ed., Freeman Press, 2017
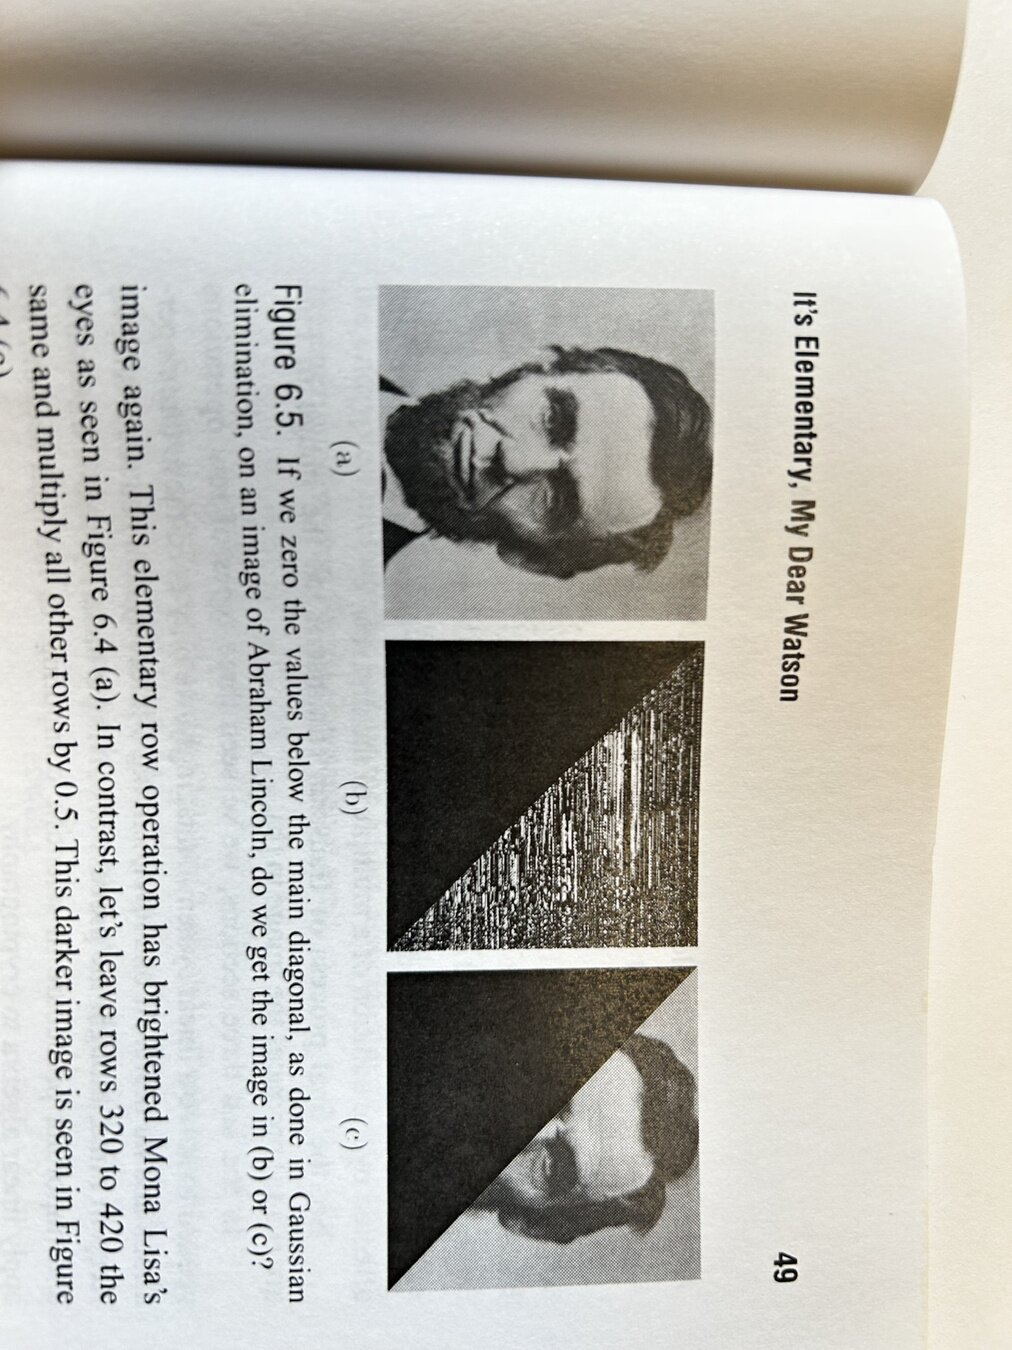
An issue with applications...
Many things you could do to a matrix are nonsense for images.
Chartier, When Life is Linear, MAA 2015
Applications are selected because they work.
(& Solving a solved problem might not scratch the itch for something "new".)
I'm not saying avoid SVD for image compression examples!
I'm saying:
Perhaps a student (teacher?) may struggle to
know when/why SVD worked here, and a
different tool elsewhere.
A case study in archetypes....
Refined Goal:
Locate an intuition about when to use the SVD, and an archetype to deliver that intuition.
Pull a thread of releted curiosity...
-
Eyeballs are round
-
Lenses are round
-
Why is a photo rectangular?


-
Mechanics of film strips
-
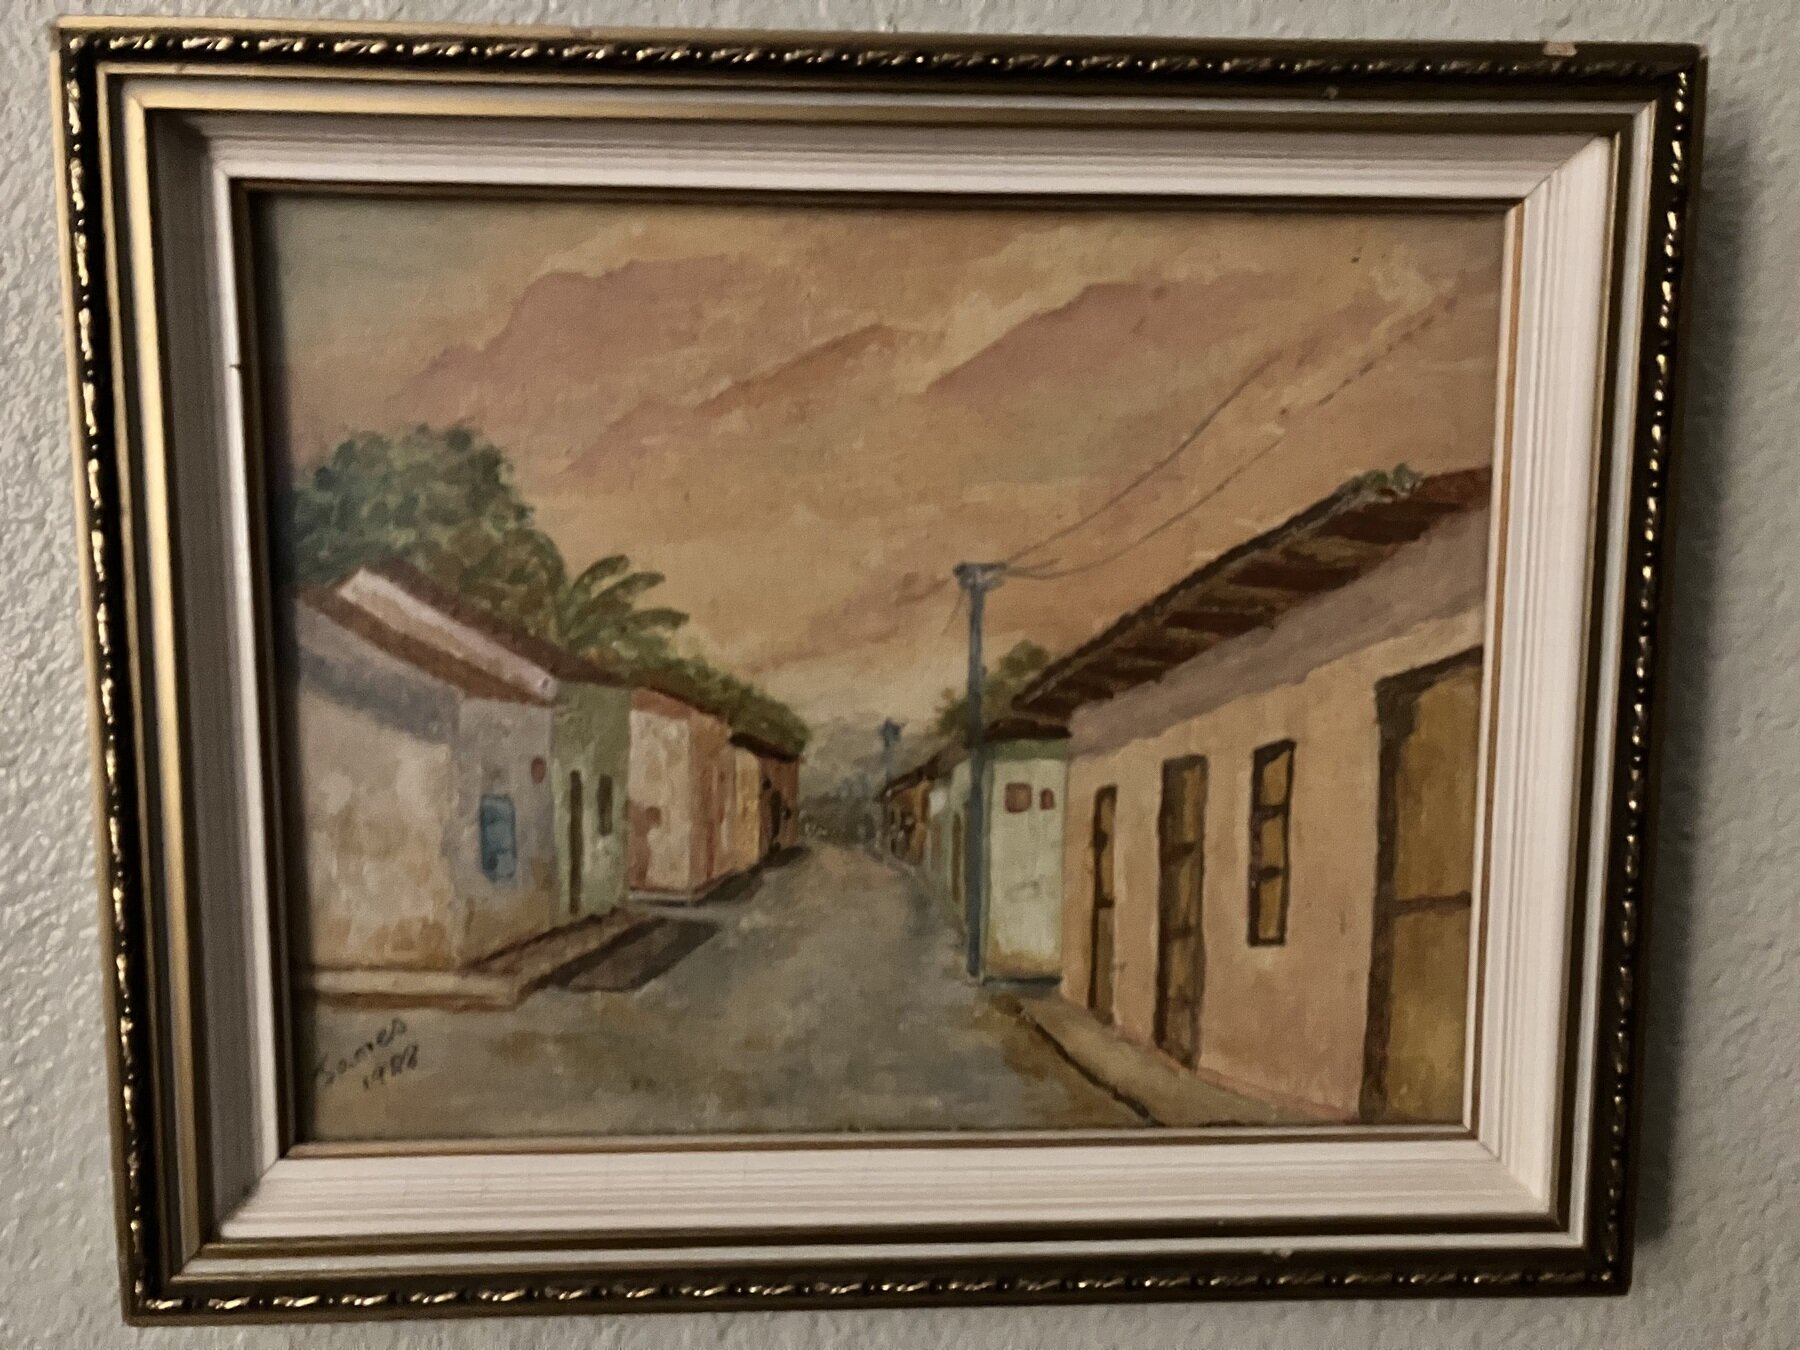
Artwork architecture
-
So you can use the SVD to compress the image...said no one.

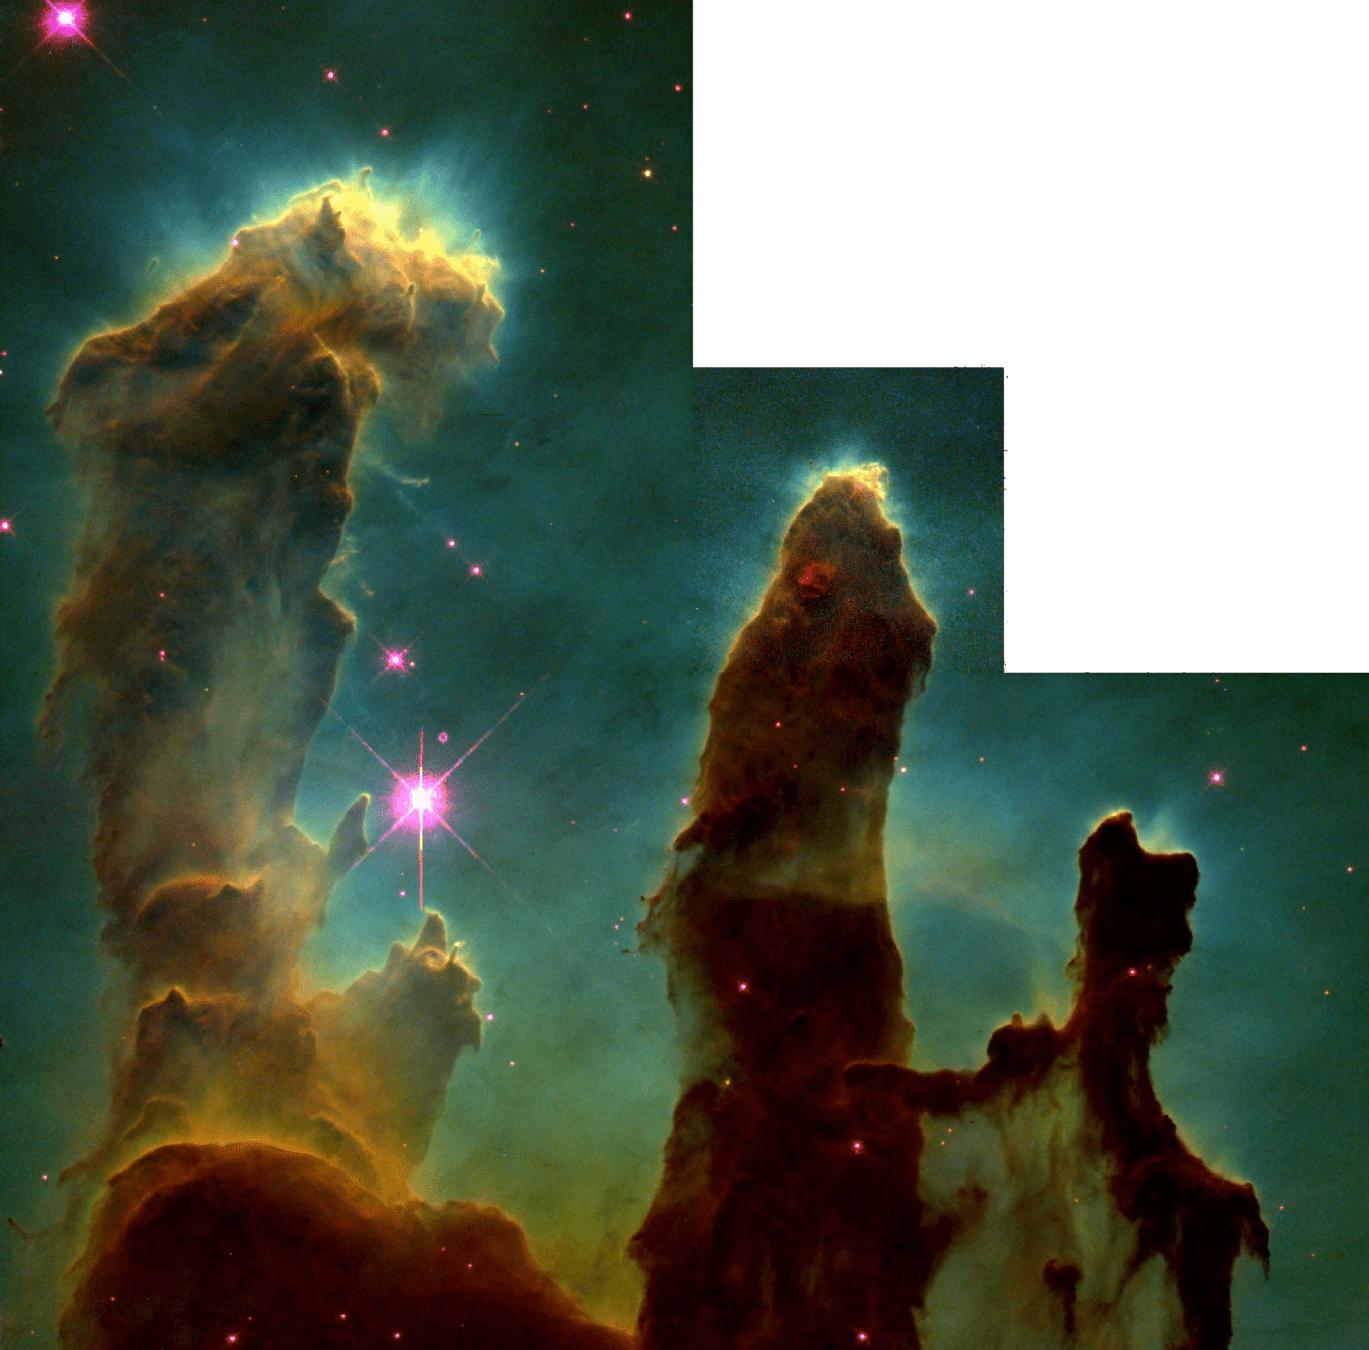
ENTER THE VEIW MASTER
And Aerial photography
And Space photography
And Microscopes....
Lets revisit SVDs with these!

Reinvent Image compression under this tension.
-
Choose an archetype symbol.
-
Choose an archetype character
-
Tell your story through the character and symbols.
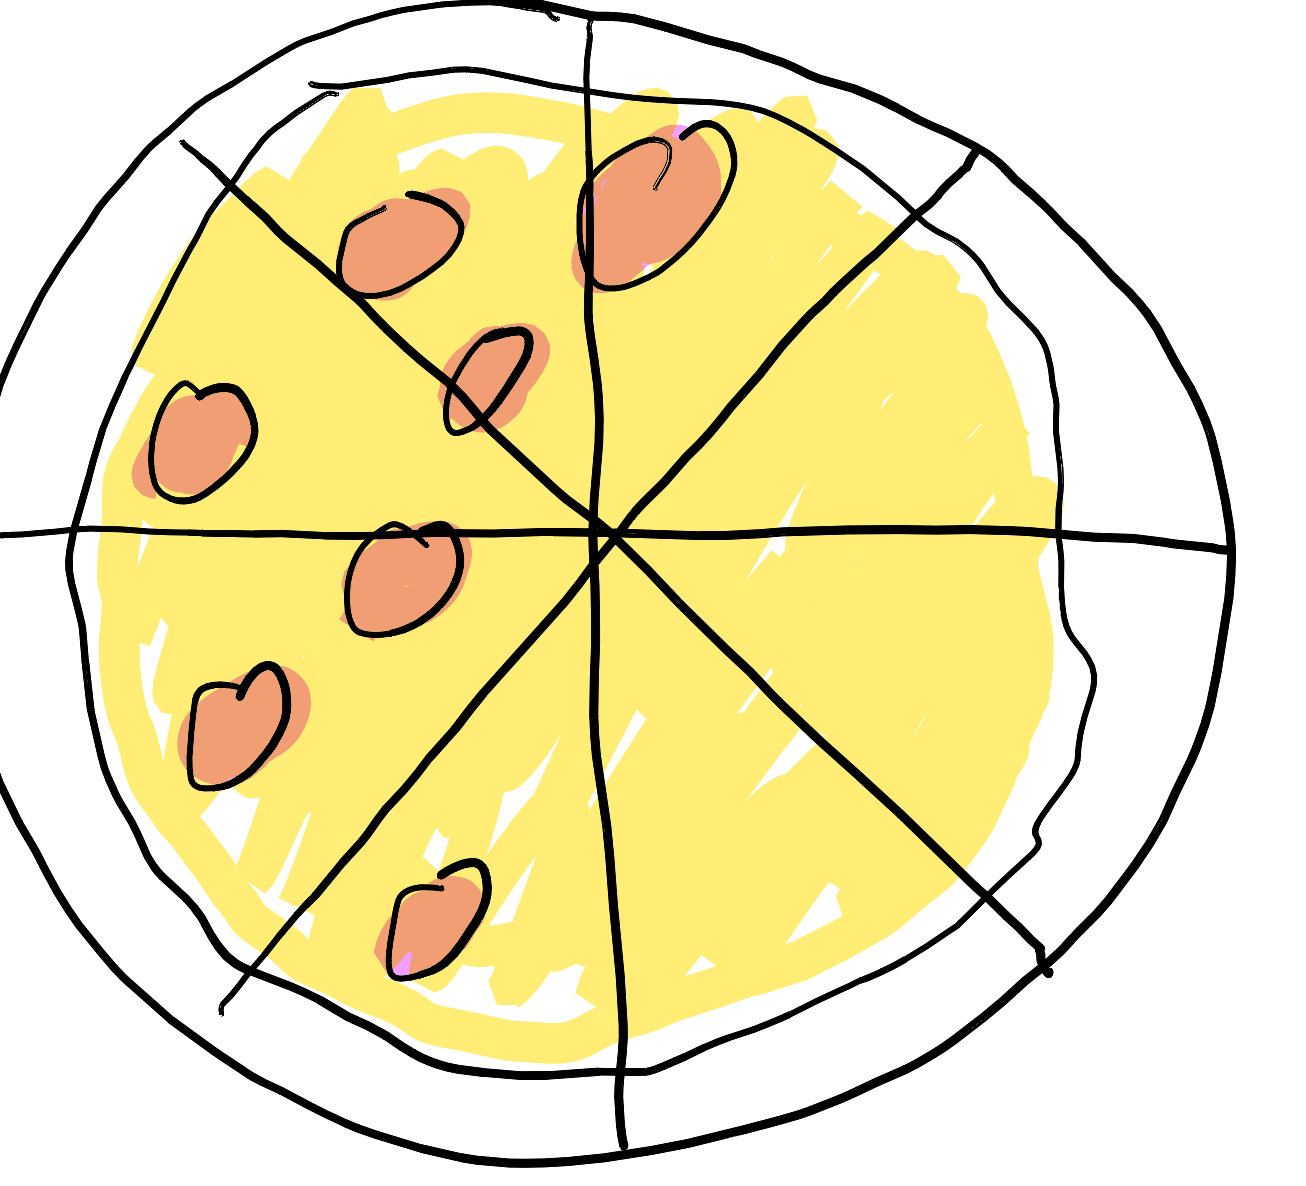
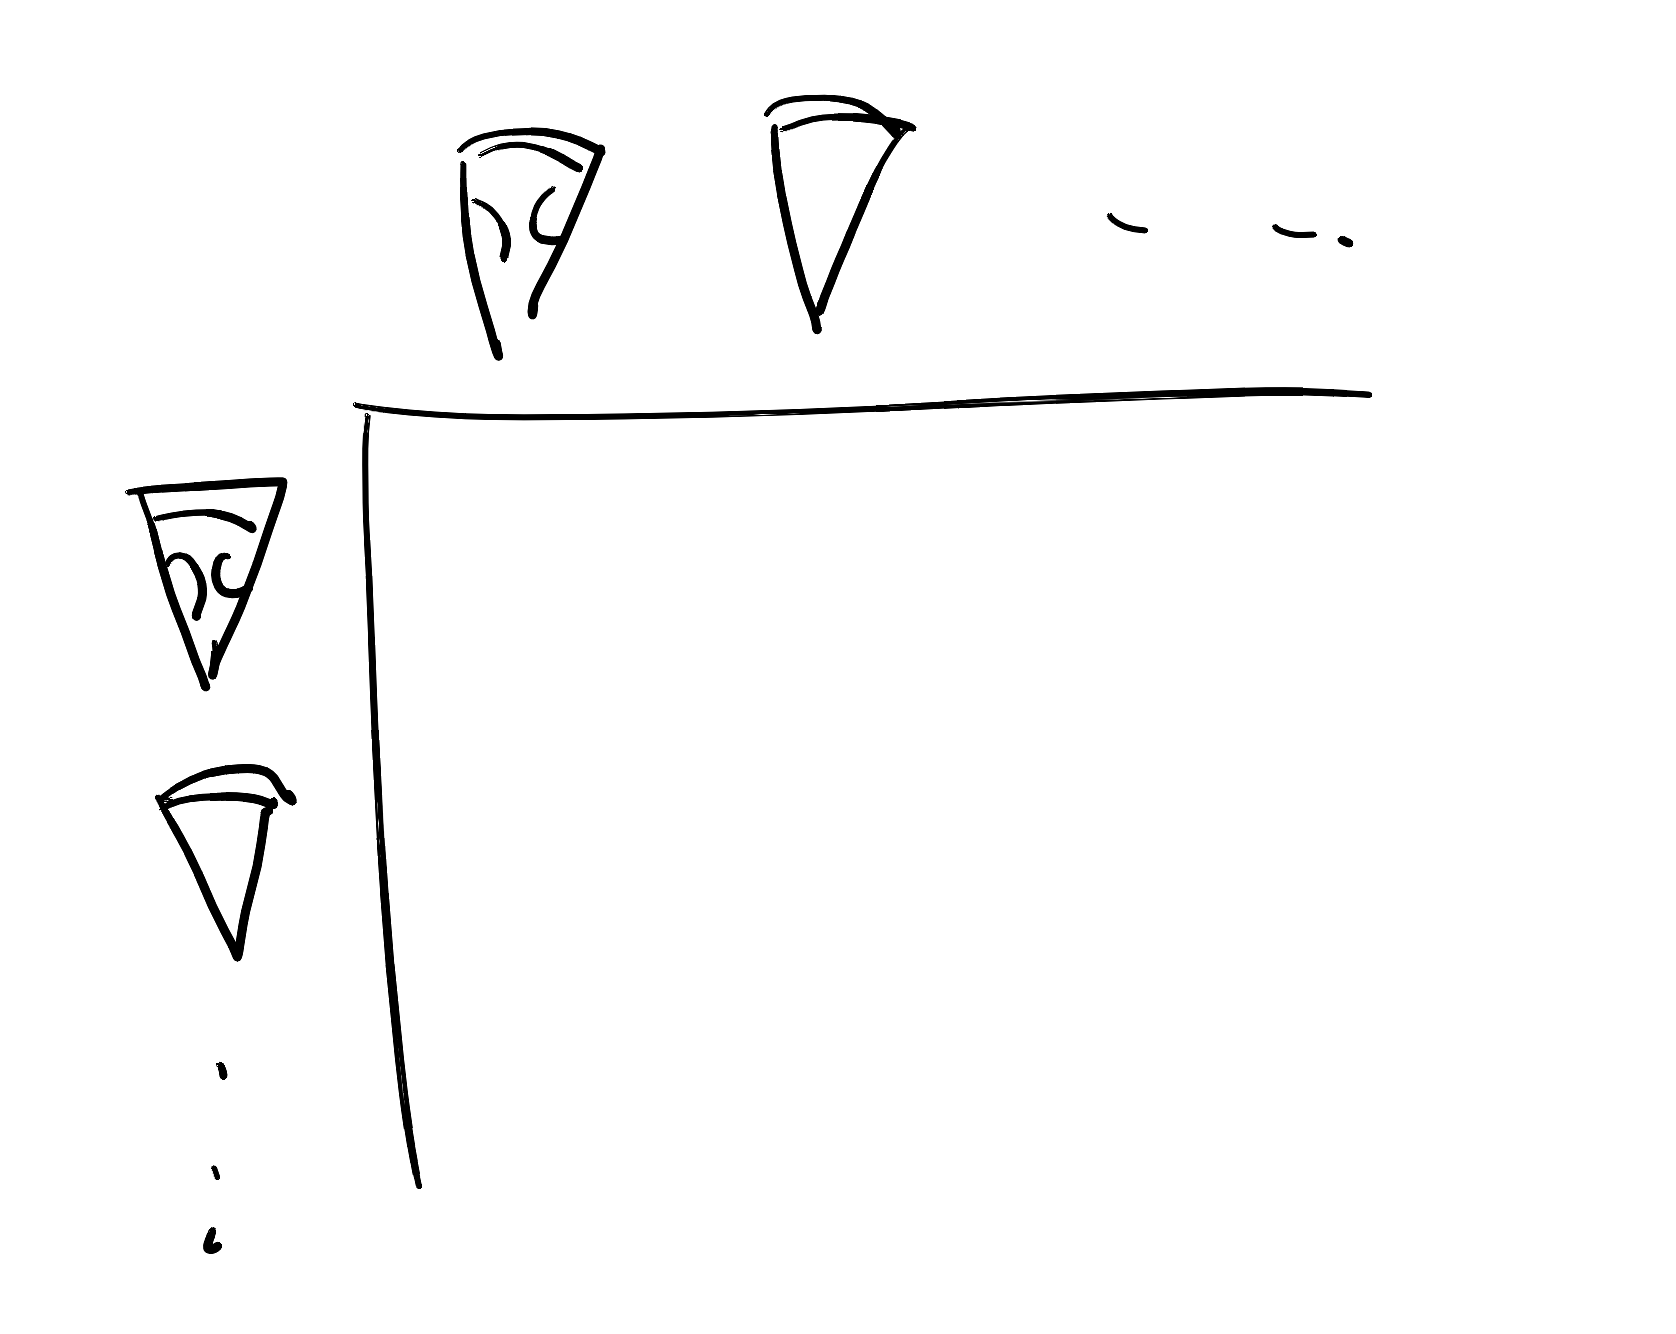
One day a pizza arrived at Lineum's home. Half cheese, half pepperoni! Yumm!!
Somewhere into his 5th slice, Matica sent Lineum a message:
Send me a picture of the pizza I ordered so I can make sure it was made right!
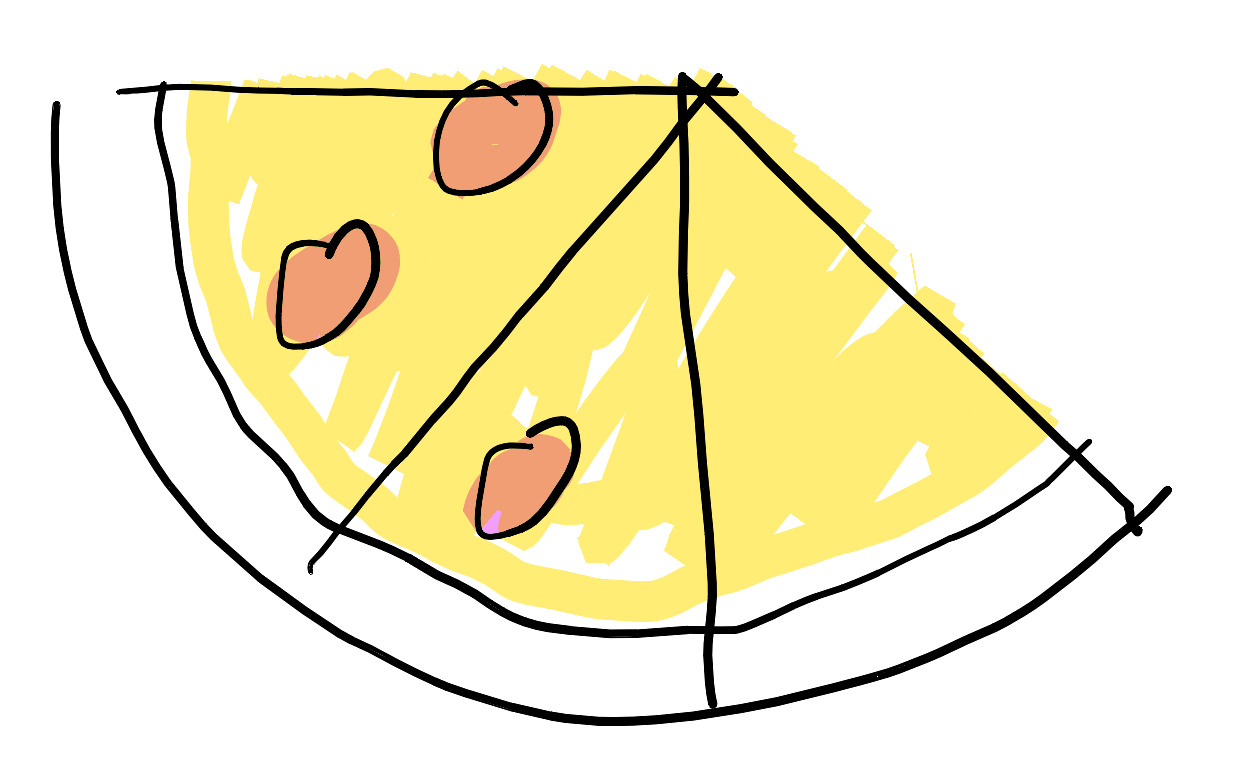
Panicked, Lineum stared at the pieces left then hatched a plan. He took a photo and then cut and pasted the pieces to make a whole pie and sent it to Matica.
Moral: Some ways to cut up data have a remarkable amount of similarities to the whole.
How had she known he'd already started eating it?!
Great! Glad you liked it, but save me the rest!
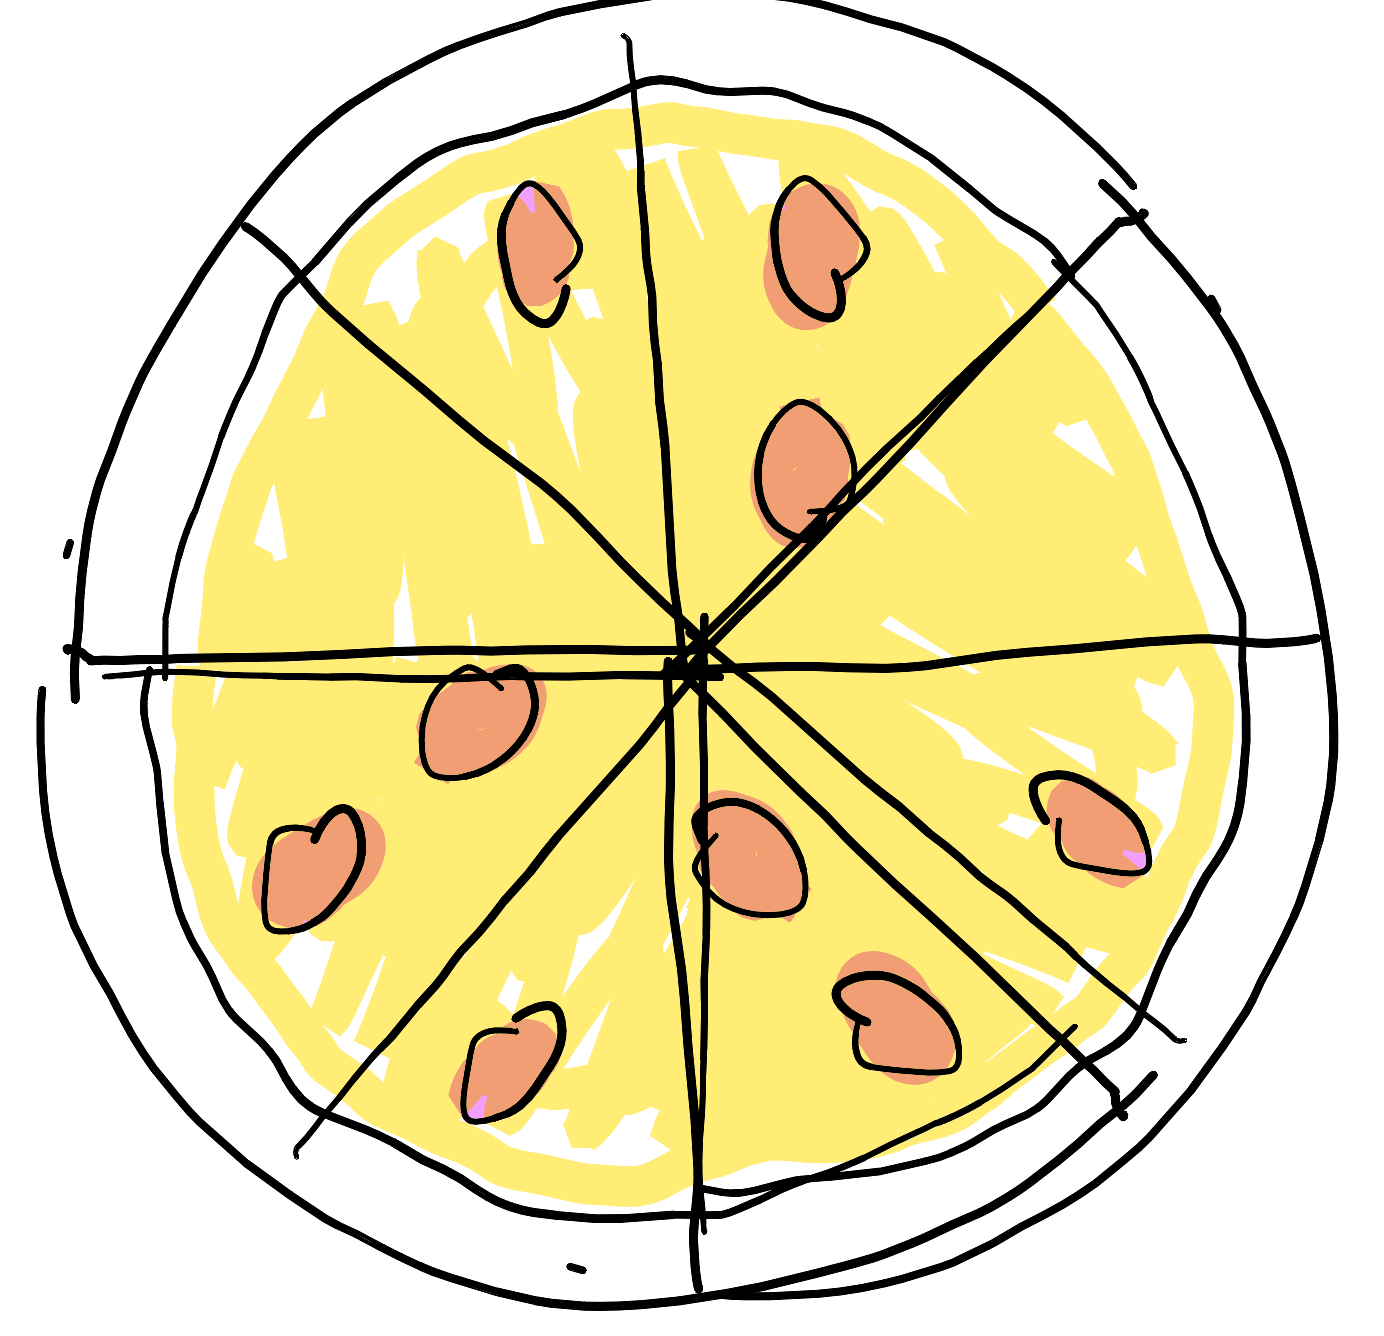
Which way to cut the pizza makes each piece the most alike?
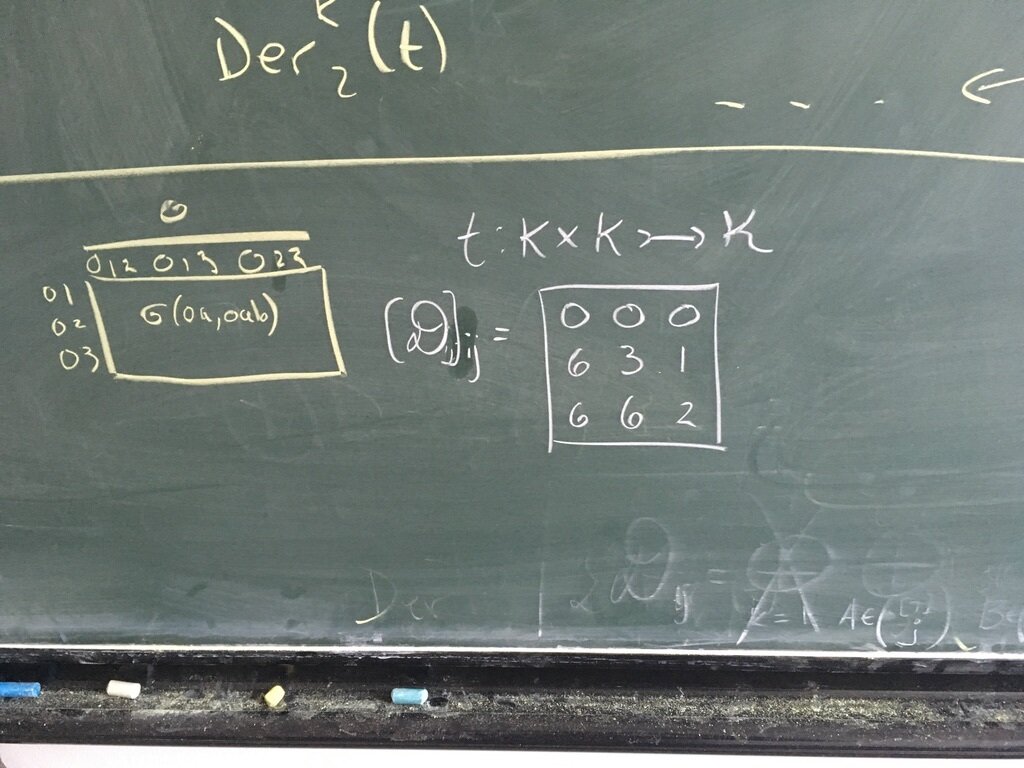
If you measured the similarities between all the parts in a table
Introduce dot-product to measure similarity, make a table of all dot-products
Given an ordered set \(M\subset V\) of vectors... this table is non-other than
\[M^{\top} M\]
We are on our way to explaining the SVD and why it was informative here.
Vector Data is spectral when the dot-products are informative to your questions.
(Tautology) The SVD is informative when your Vector Data is spectral.
M\subset V, M^{\top} M\in \text{Info}(\text{Problem})
Label Their Learning, add the Icon
Is this spectral?
The adjacency of a graph vertex?
Adjacent to 1 \(v_1=\begin{bmatrix} 1 & 2 & 3 & 4 & 5 & 6 \\ \hline 0 & 1 & 0 & 1 & 0 & 0 \end{bmatrix}\)
1
2
3
4
5
6
Adjacent to 5 \(v_2=\begin{bmatrix} 1 & 2 & 3 & 4 & 5 & 6 \\ \hline 0 & 1 & 0 & 1 & 0 & 1 \end{bmatrix}\)
\(v_1\cdot v_5=2\) and that's the number of vertices in common....seems informative for graph theory questions....SPECTRAL!
Now Just something for the Teacher of Data Science Linear Algebra
Address the Topic Mindset
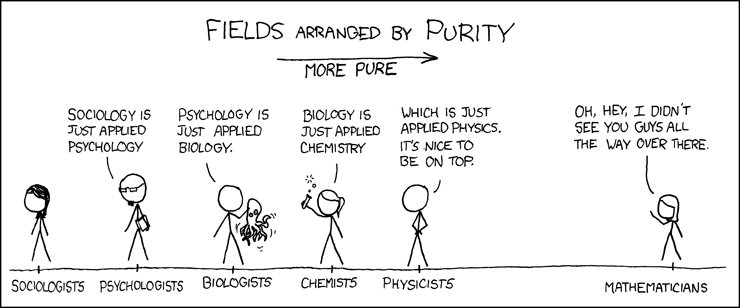
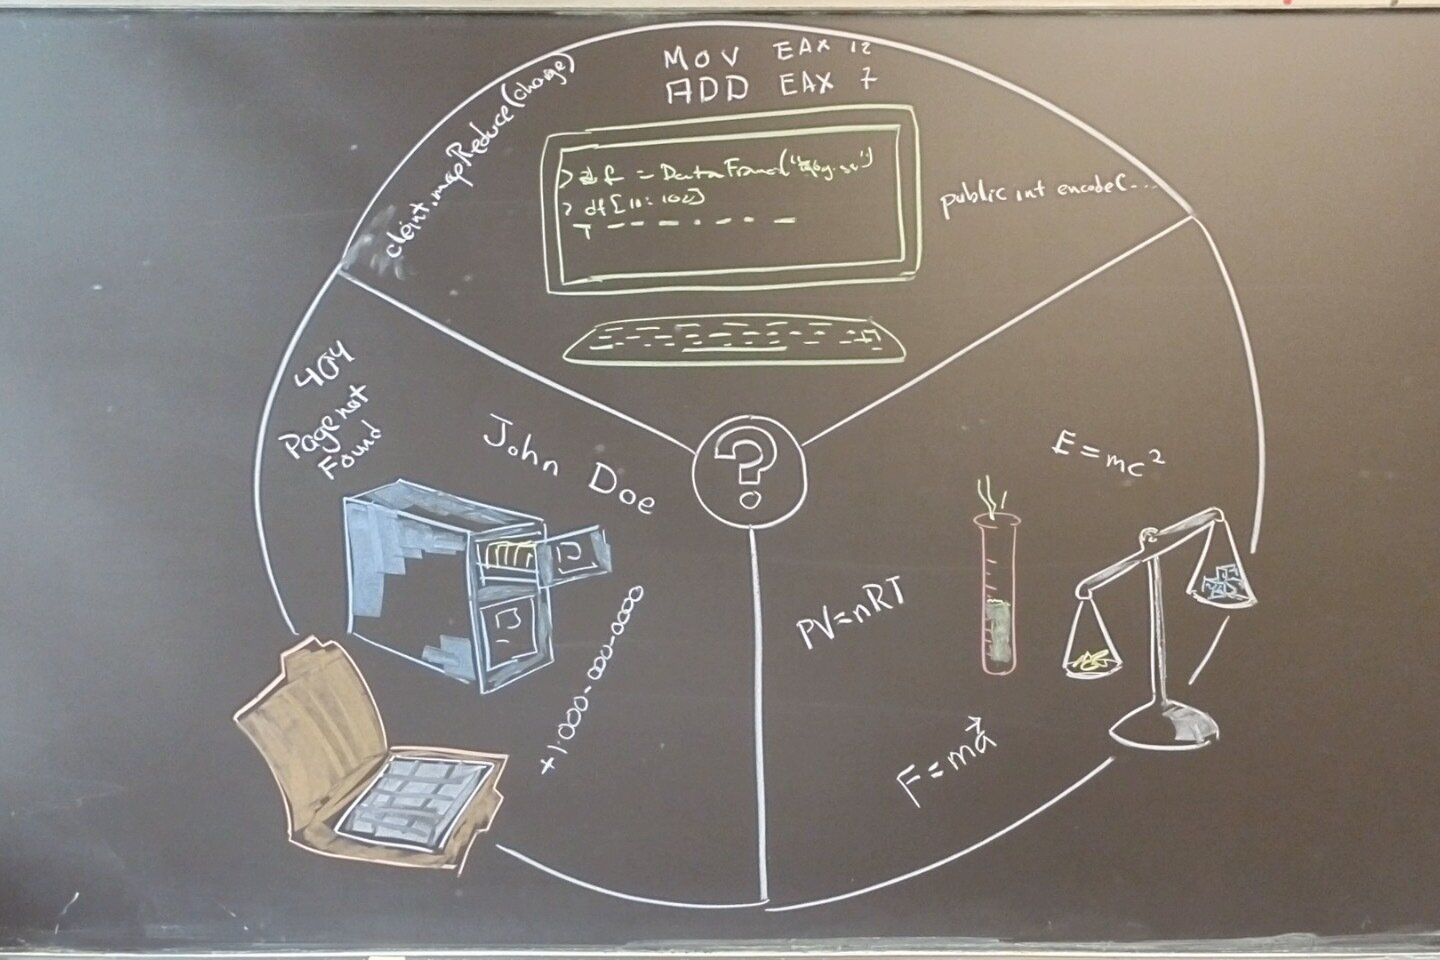
(Data) Science as a WEB not a Spectrum
Diverse backgrounds can inform each other
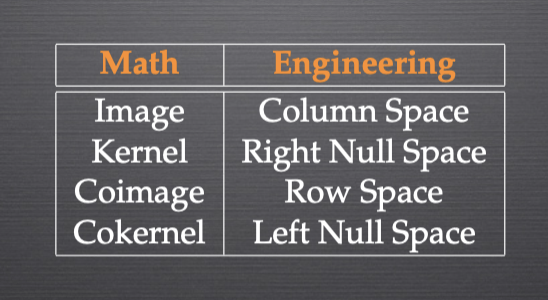
\[\text{Null}(M)=\{u\in \mathbb{R}^n\mid Mu=0\}\]
This is not a set!
> M = [1.0 2 3 4;  2 1 4 3]
2×4 Matrix{Float64}:
 1.0  2.0  3.0  4.0
 2.0  1.0  4.0  3.0
> N = nullspace(M)
4×2 Matrix{Float64}:
 -0.750331  -0.330783
  0.127332  -0.810062
  0.572331   0.00482762
 -0.305332   0.484106
Diverse backgrounds can inform each other
> M = [1.0 2 3 4;  2 1 4 3]
2×4 Matrix{Float64}:
> N = nullspace(M)
4×2 Matrix{Float64}:
> M*N == zeros(2,2)
false
> M*N
2×2 Matrix{Float64}:
  6.66134e-16  2.22045e-16
 -1.11022e-16  0.0
> isapprox( M*N, zeros(2,2))
true
\(\mathbb{R}^m\)
\(\mathbb{R}^n\)
\(\mathbb{R}^e\)
\(M\)
\(N\)
\(\mathbb{R}^0\)
Numerical Experience helps theorist appreciate why "simple" stuff is hard.
\([]\)
\([]\)
Diverse backgrounds can inform each other
> M = [1.0 2 3 4;  2 1 4 3]
2×4 Matrix{Float64}:
> N = nullspace(M)
4×2 Matrix{Float64}:
> isapprox( M*N, zeros(2,2))
true
> X = [-0.419547;  0.937394;
         0.56750; -0.78943 ]
> isapprox( M*X, zeros(2,1))
true
> N \ X
2-element Vector{Float64}:
  1.0
 -1.0
> isapprox( N * (N \ X), X)
true
A theorist helps explain the reality of code (its Categories not Sets)
\(\mathbb{R}^m\)
\(\mathbb{R}^n\)
\(\mathbb{R}^e\)
\(M\)
\(N\)
\(\mathbb{R}^0\)
\(\mathbb{R}^e\)
\(X\)
\(N\backslash X\)
\([]\)
\([]\)
\([]\)
\(\leftarrow\) Left Page
Right Page \(\rightarrow\)
Example
Synergy
How about a math class that embraces the good in A.I. while prepping for the hard work?
In our Math for Computational Science
Students get a prompt
-
Merge 2 databases (a lesson in inconsistency)
-
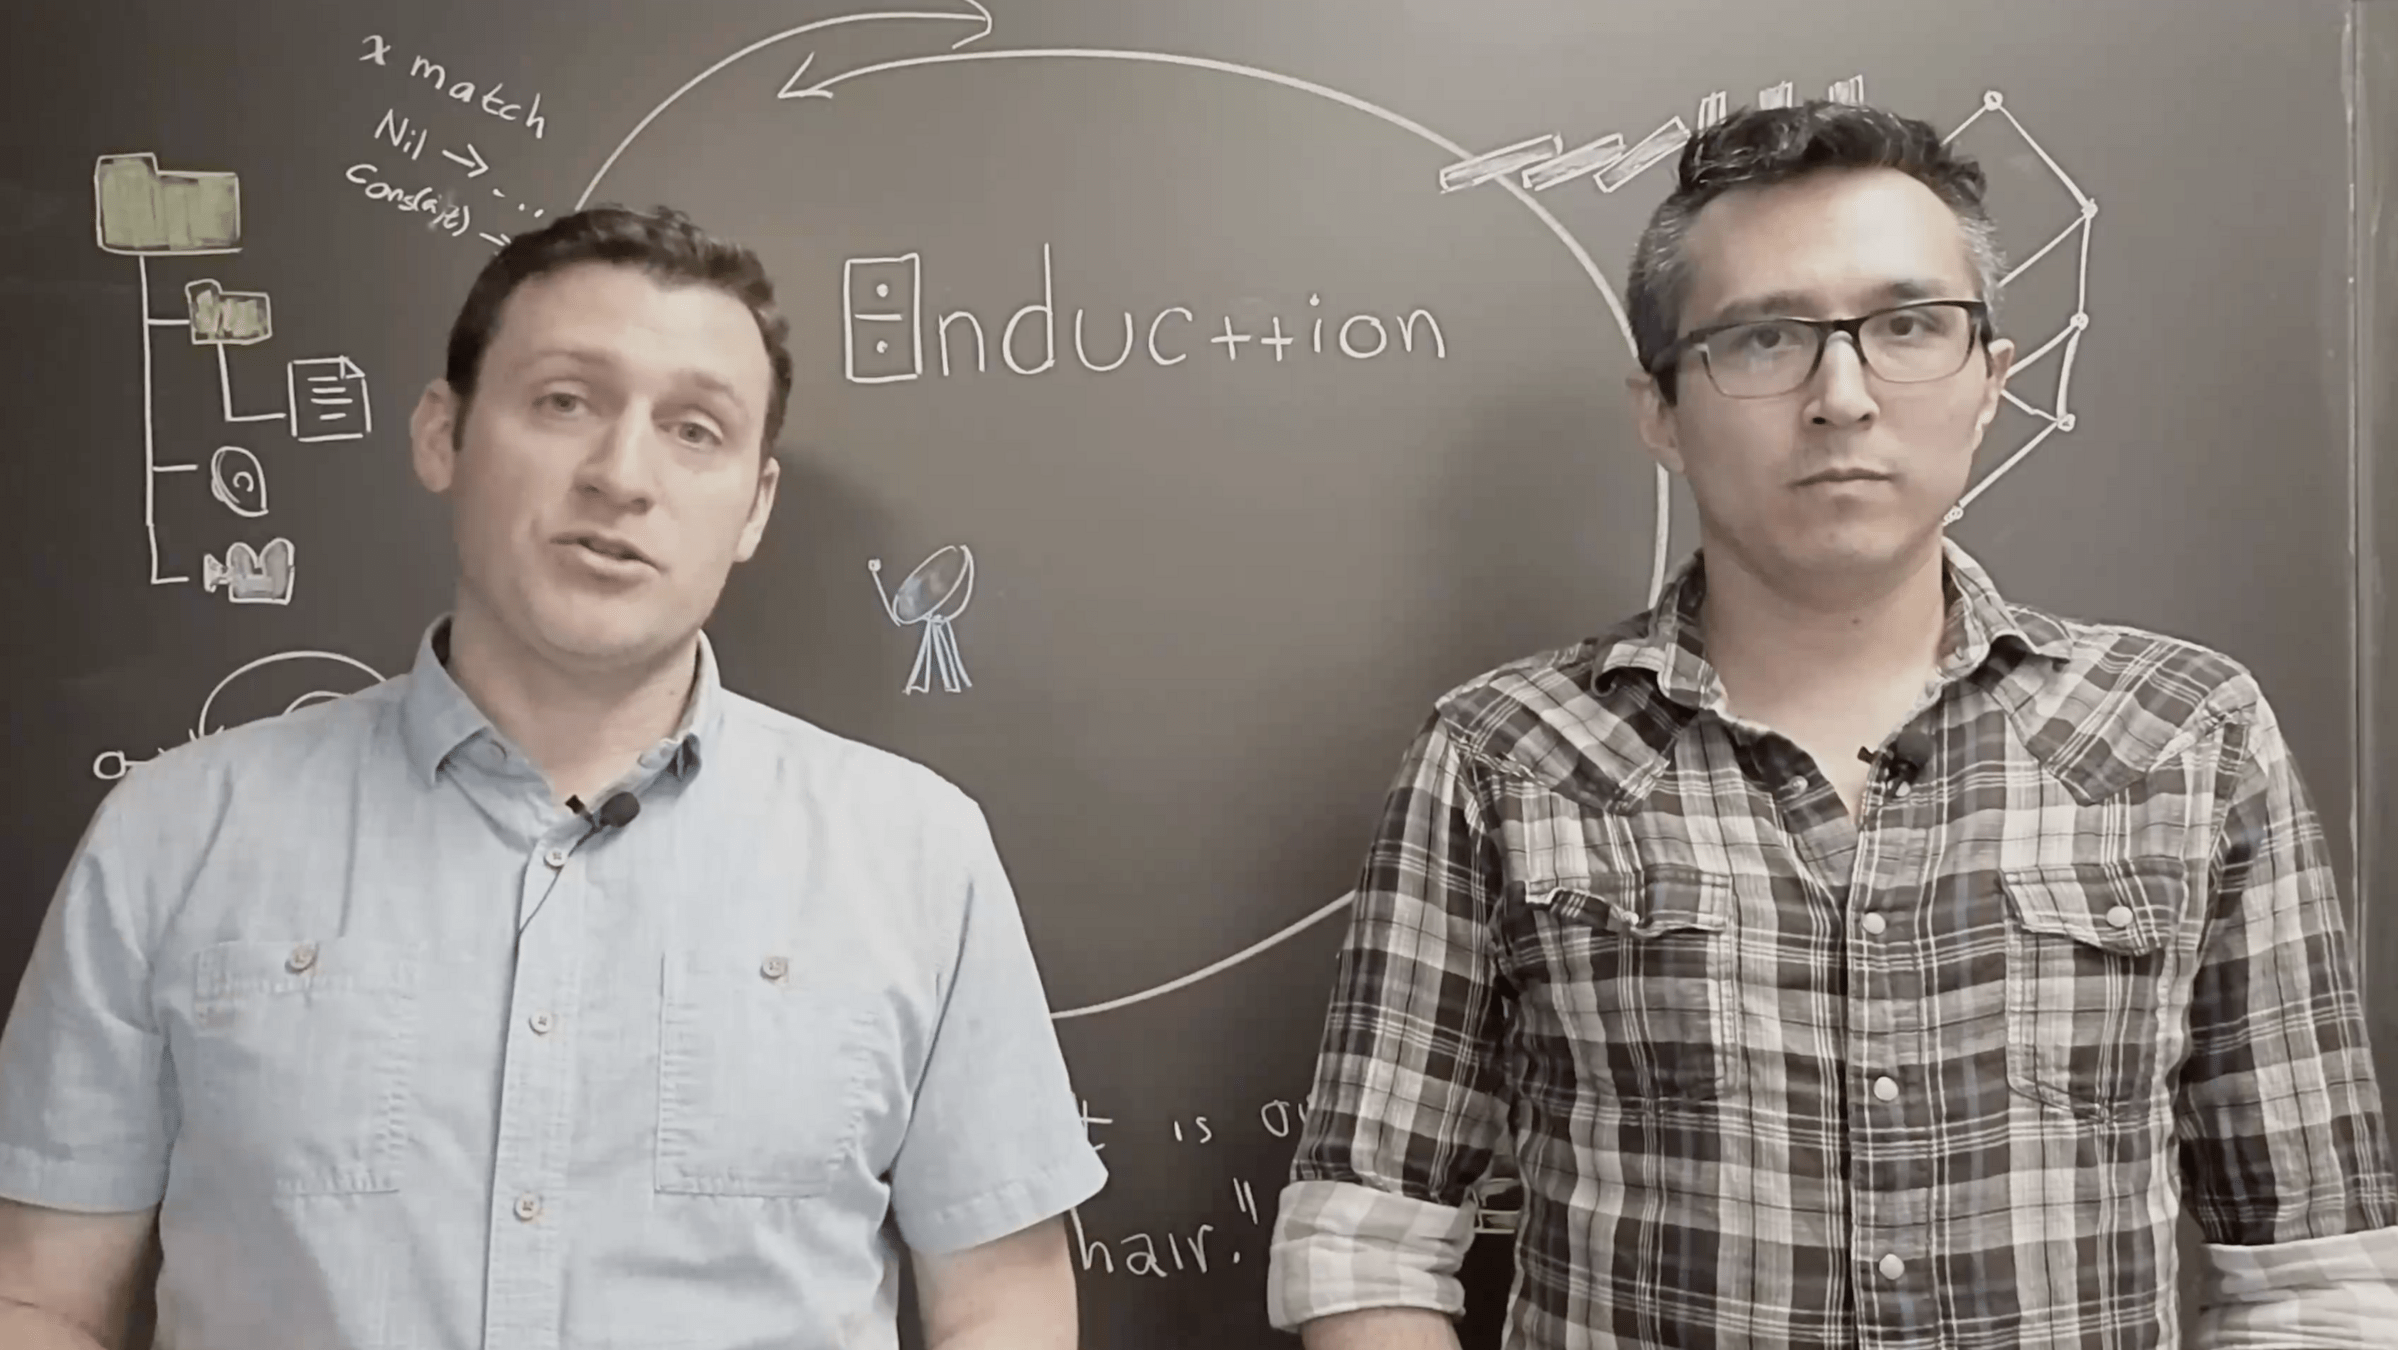
Design a Social Media post (a lesson in induction)
-
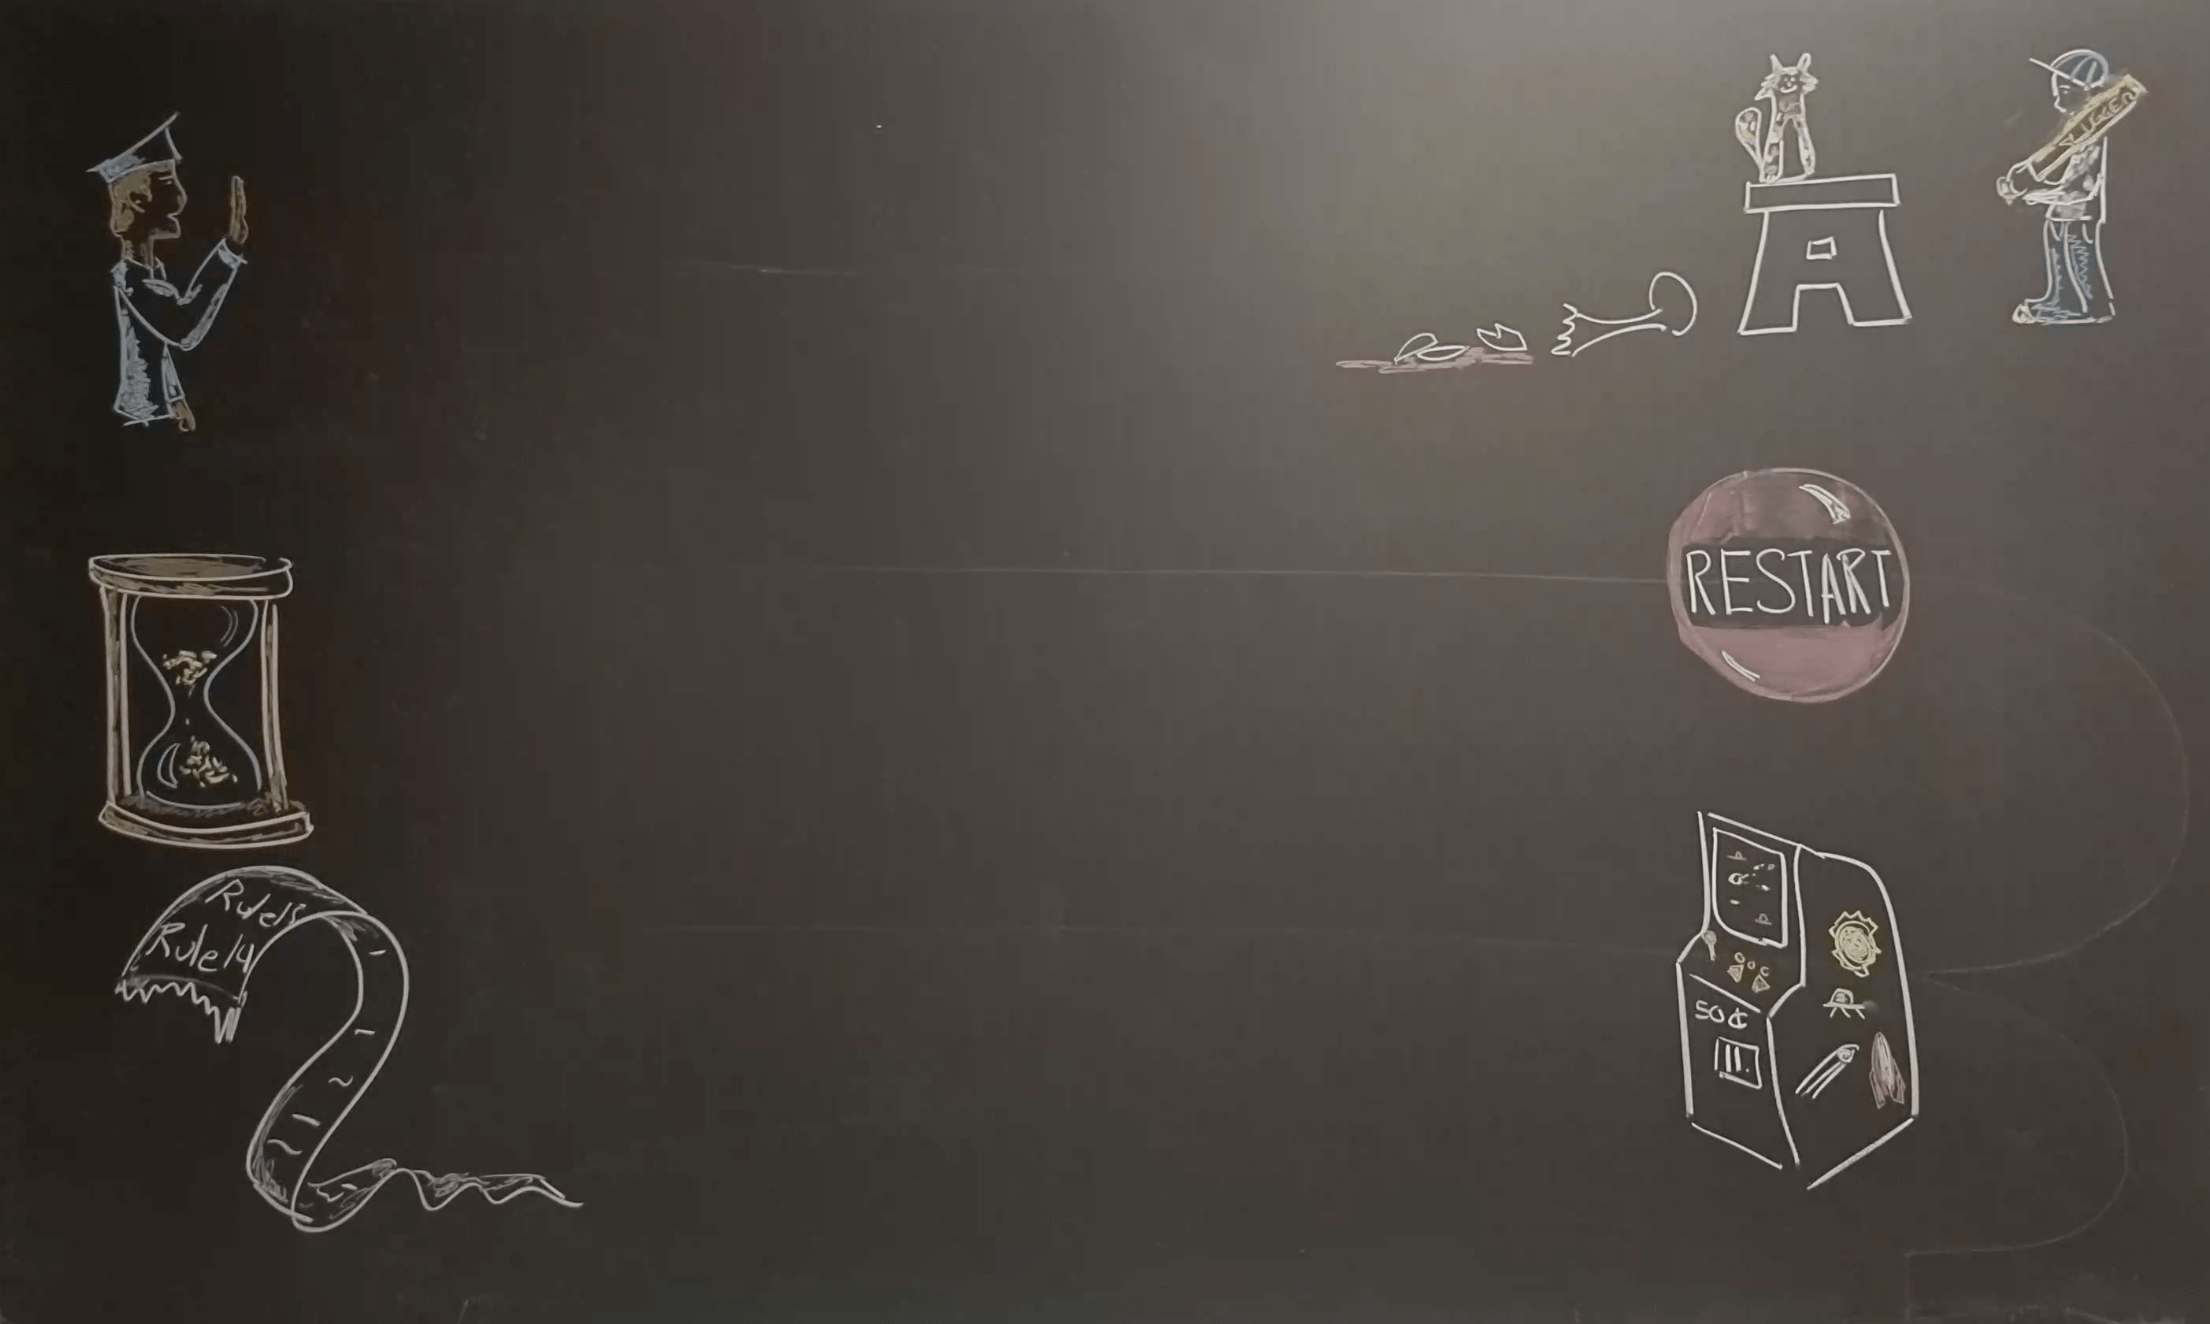
Deal with a faulty passport scanner while complying with the law (a lesson in adaptive logic)
-
Detect signals of a healthy power grid (a lesson in limits)
They make themselves the story
Help!
-
Does any of this work?
-
Does any of it do harm?
-
Can you contribute?
No time for all that? Do at least this...
-
Provide data sets
-
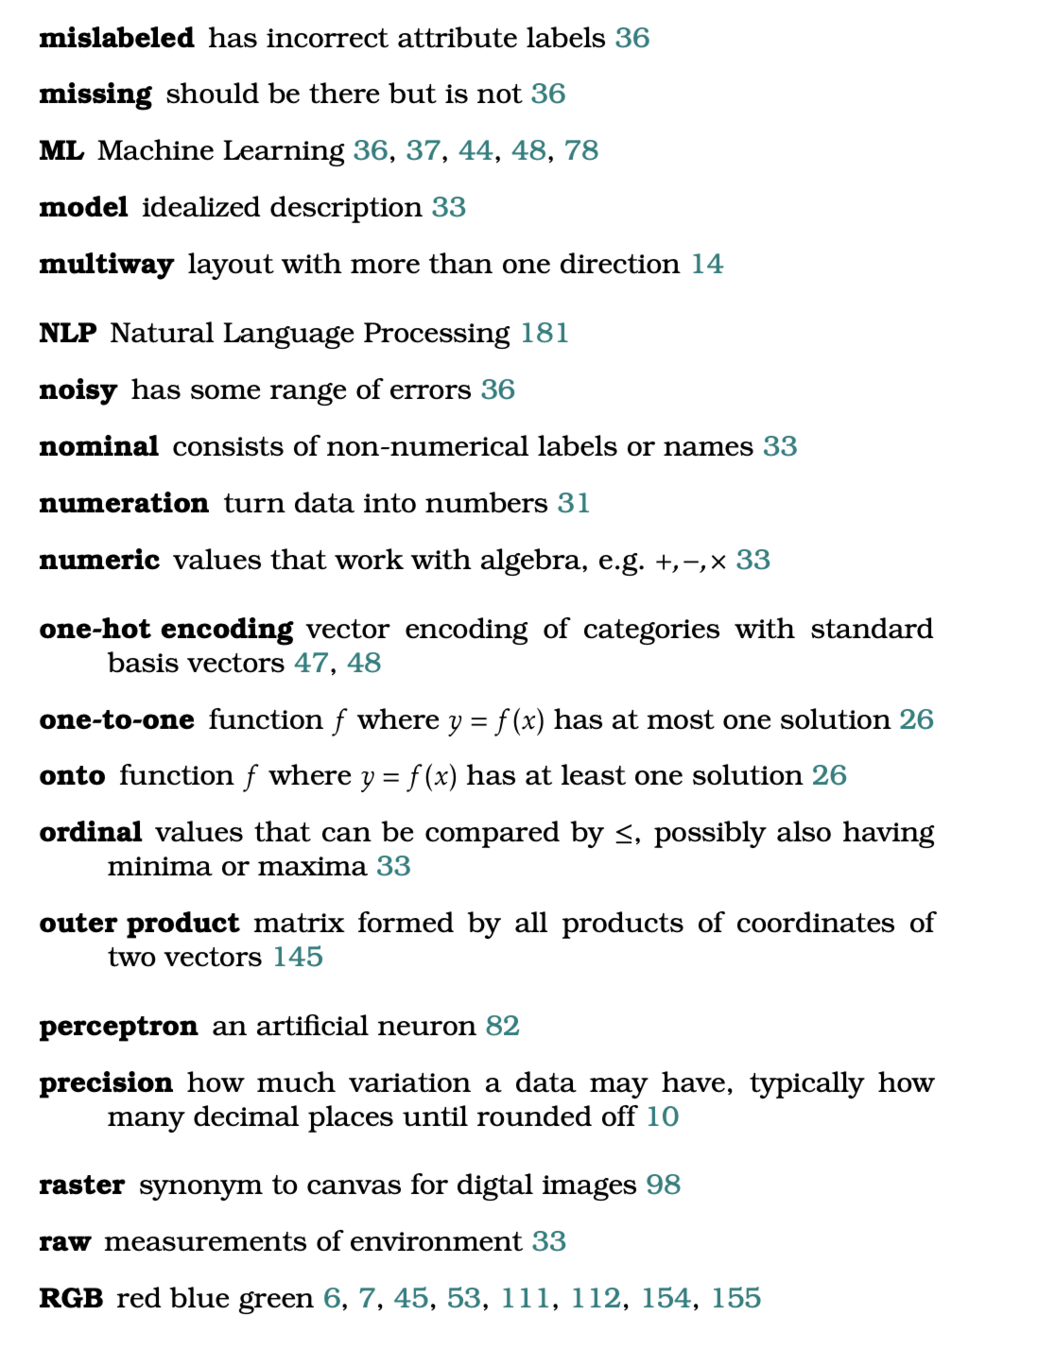
Provide keyword glossaries
-
Frame content after the uses not the methods
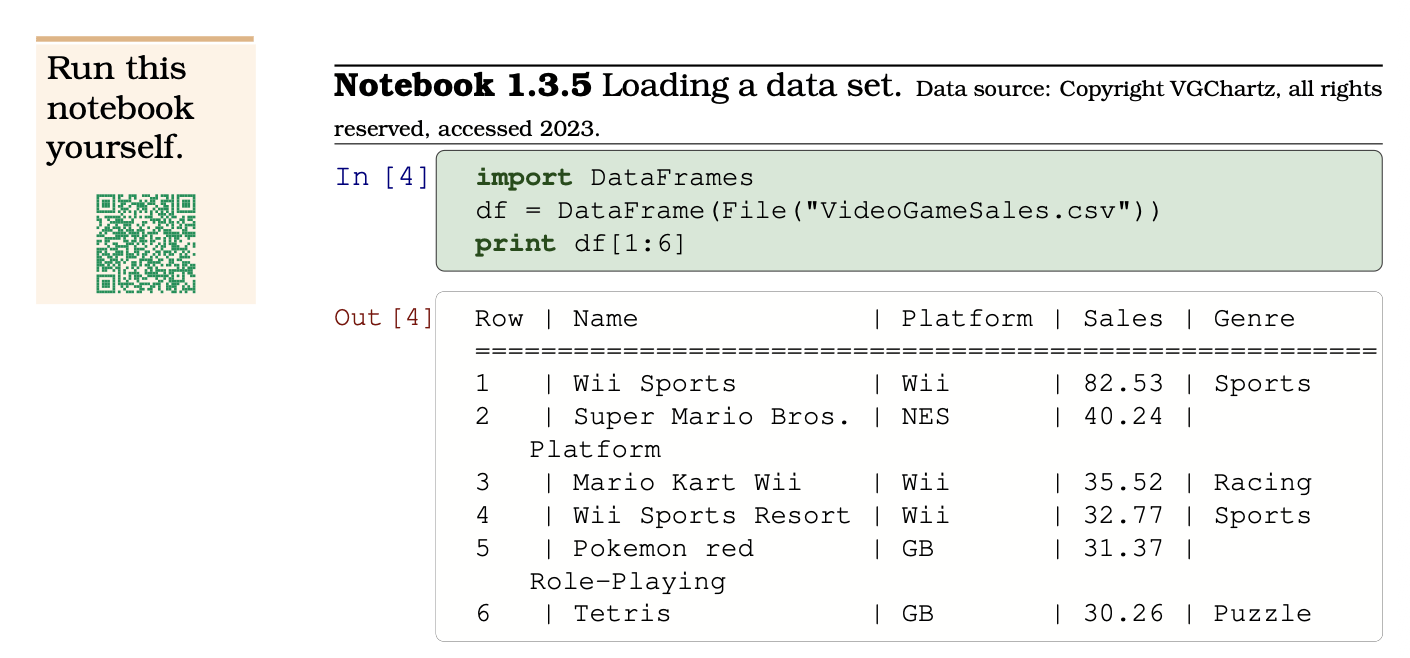

Data Science instructors deserve to be given data!
Open Sources
Links to Reproduce textbook
Repos of labs
Math trained
Data Science instructors need quick jargon
Provide a glossary (they can read that while walking to class if they have to)
Don't want applications skipped in favor of abstraction?
Try naming every unit after its use instead of its methods
From Math for Computation
Before
Default & Adaptive Logic
After
Responding to Confusion
From Data Science
Before
Inner Products
After
Feature Extraction
Who can do it?
If you leave here and talk about this to someone else then you too are a story teller.
And XKCD was just stick figures.

https://LinearData.Space
https://PleaseDistribute.Org (my website)
Mathematical Archetypes
By James Wilson
Mathematical Archetypes
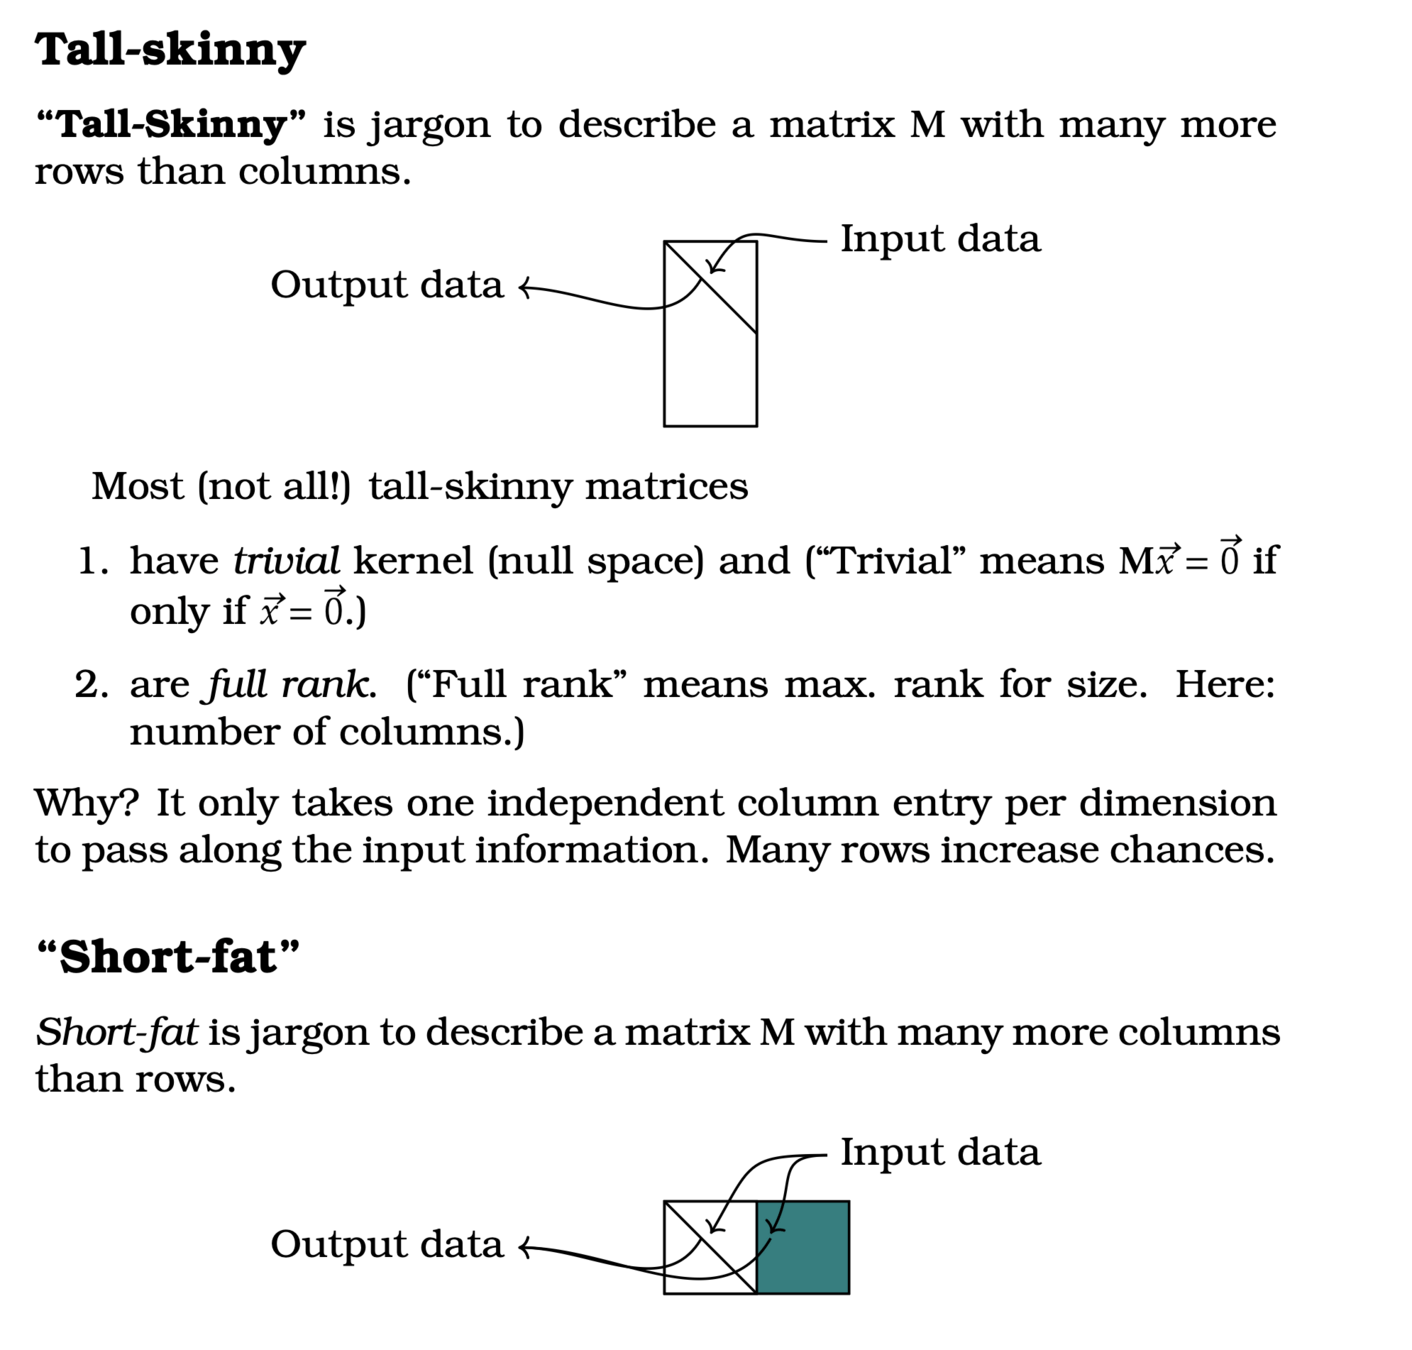
How can we train a workforce on the cutting edge technology when the teachers haven't been trained themselves? One option is through archetypes: stories that reveal patterns


