


2018
It all starts with sharing
José M. Pérez and I wanted to share knowledge about web performance
We started doing YouTube reviews
We analyzed real sites: we loaded the page, opened DevTools and explained what we saw

Web performance knowledge was dispersed and hard to access
From reviews to audits
The public reviews generated interest
Companies started asking us for performance audits
Same process, but for a client:
- Open DevTools
- Measure LCP, CLS, INP
- Detect image, font, and script issues
- Document findings
The problem of repeating yourself
In every audit, the same analyses
Copying and pasting the same JavaScript fragments over and over into the console
First step: save the scripts for reuse
What repeats, gets automated
Chrome DevTools: the Snippets tab
DevTools has a little-known section: Sources → Snippets
It lets you save JavaScript fragments that run in the context of the current page
1. Open DevTools (F12 / Cmd+Option+i)
2. Sources tab
3. Side panel → Snippets
4. + New snippet
5. Paste the code
6. Ctrl+Enter / Cmd+Enter to run
That's where the first scripts lived.
That's where the name comes from: WebPerf Snippets
From your machine to GitHub
DevTools Snippets don't scale:
- Switch machines → lose everything
- Share with someone → impossible
- Version improvements → manual
I created the GitHub repository
The community started using them, suggesting improvements, adding new cases
Core Web Vitals · Loading · Interaction · Media · Resources
A website to browse them
With more than 40 snippets organized by category, the README became hard to consult during an audit
I needed something with search, navigation, and code ready to copy
→ webperf-snippets.nucliweb.net
A static site where each snippet has its own page, description, and copy button
Designed to keep open in one tab while working in another
Anatomy of a snippet: LCP
The LCP snippet is a good example of the pattern.
`buffered: true` → captures entries prior to execution. Works even after the page has loaded
(() => {
  const observer = new PerformanceObserver((list) => {
    const entries = list.getEntries();
    const lastEntry = entries[entries.length - 1];
    const lcpTime = Math.max(0, lastEntry.startTime - activationStart);
    // ... displays result with rating and element details
  });

  observer.observe({ type: "largest-contentful-paint", buffered: true });
})();
What it shows in the console
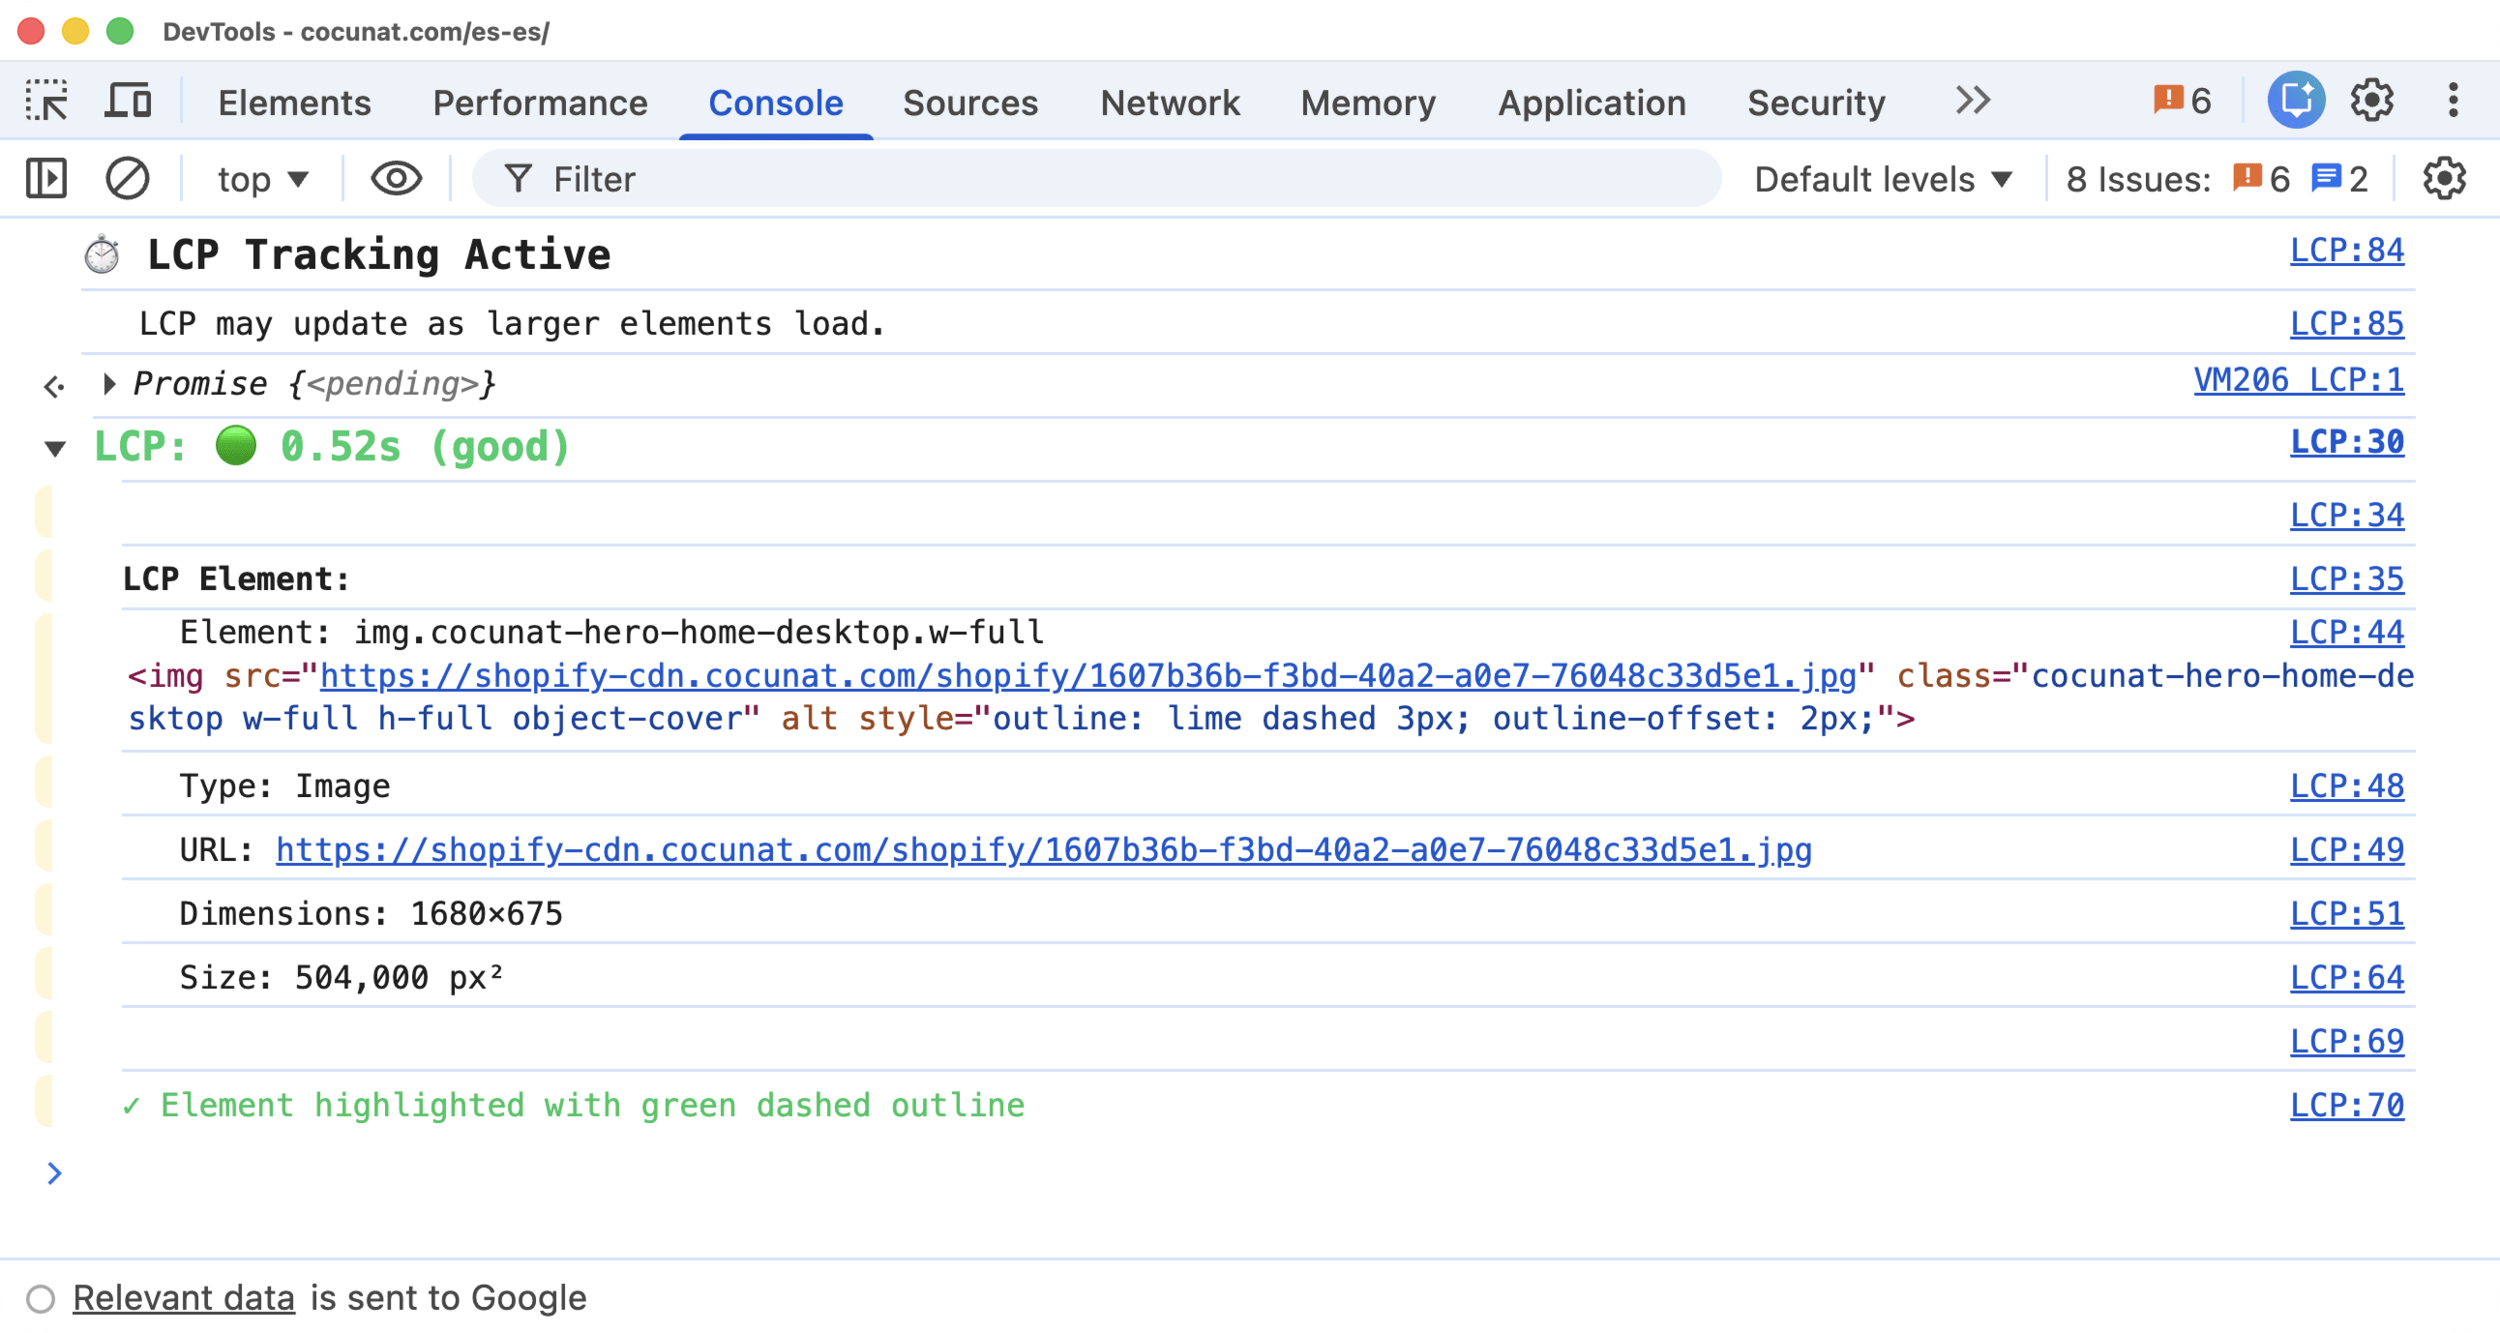
Value + rating + responsible element + type + URL + dimensions
And it outlines the element visually on the page
Snippets to detect real problems
The most useful ones in an audit cover areas rarely reviewed systematically
Image Element Audit · detects in a single pass:
- LCP without `fetchpriority="high"` or `<link rel="preload">`
- Above-the-fold images with `loading="lazy"`
- Off-viewport images without `loading="lazy"`
- Conflicting `lazy` + `fetchpriority="high"` on the same image
- Missing `width`/`height` attributes → CLS risk
- Non-modern formats outside a `<picture>` element
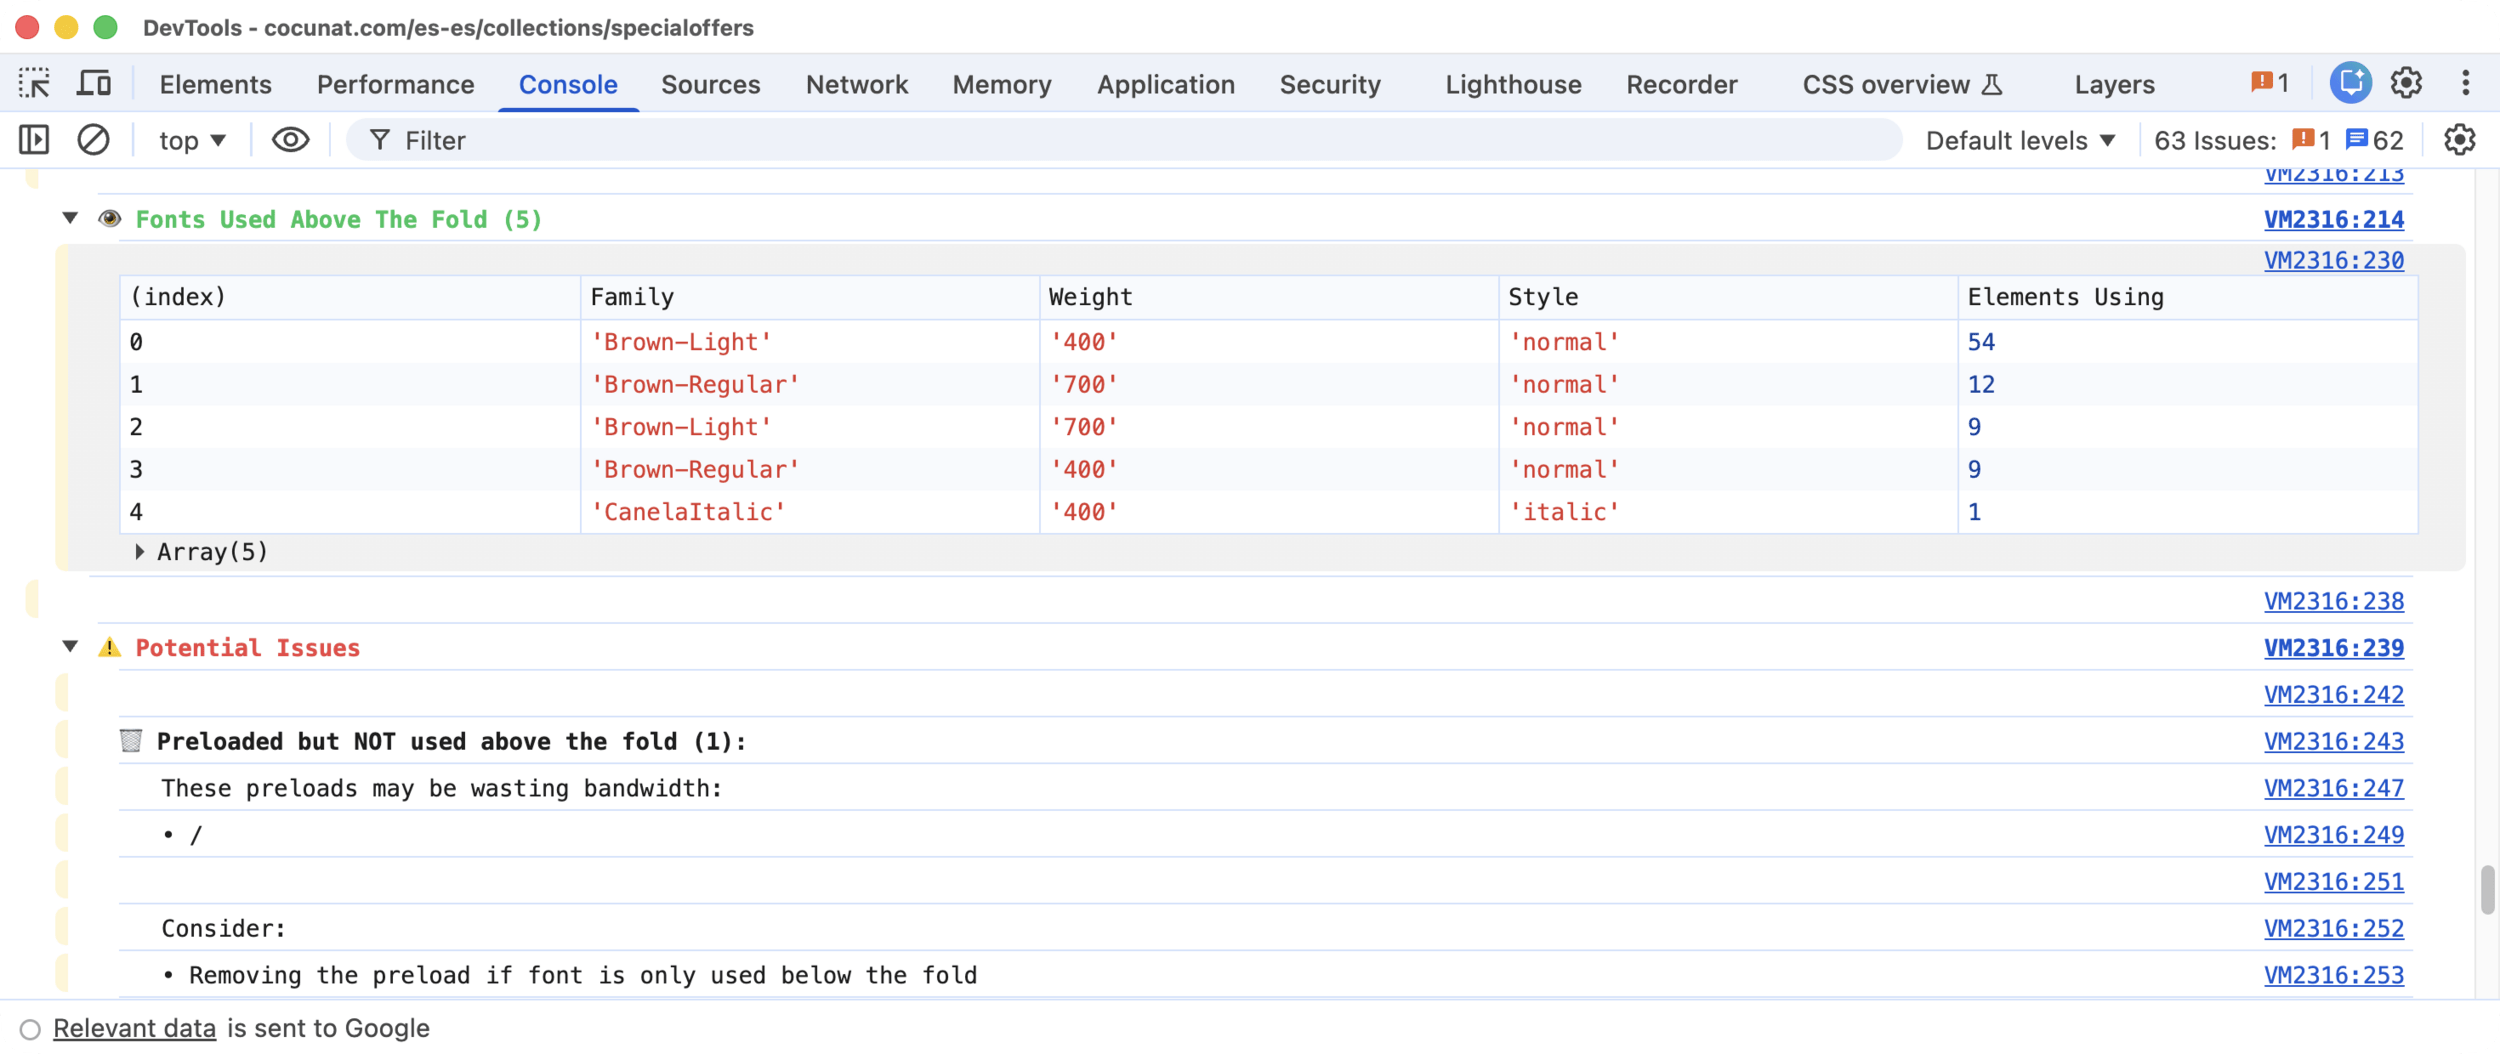
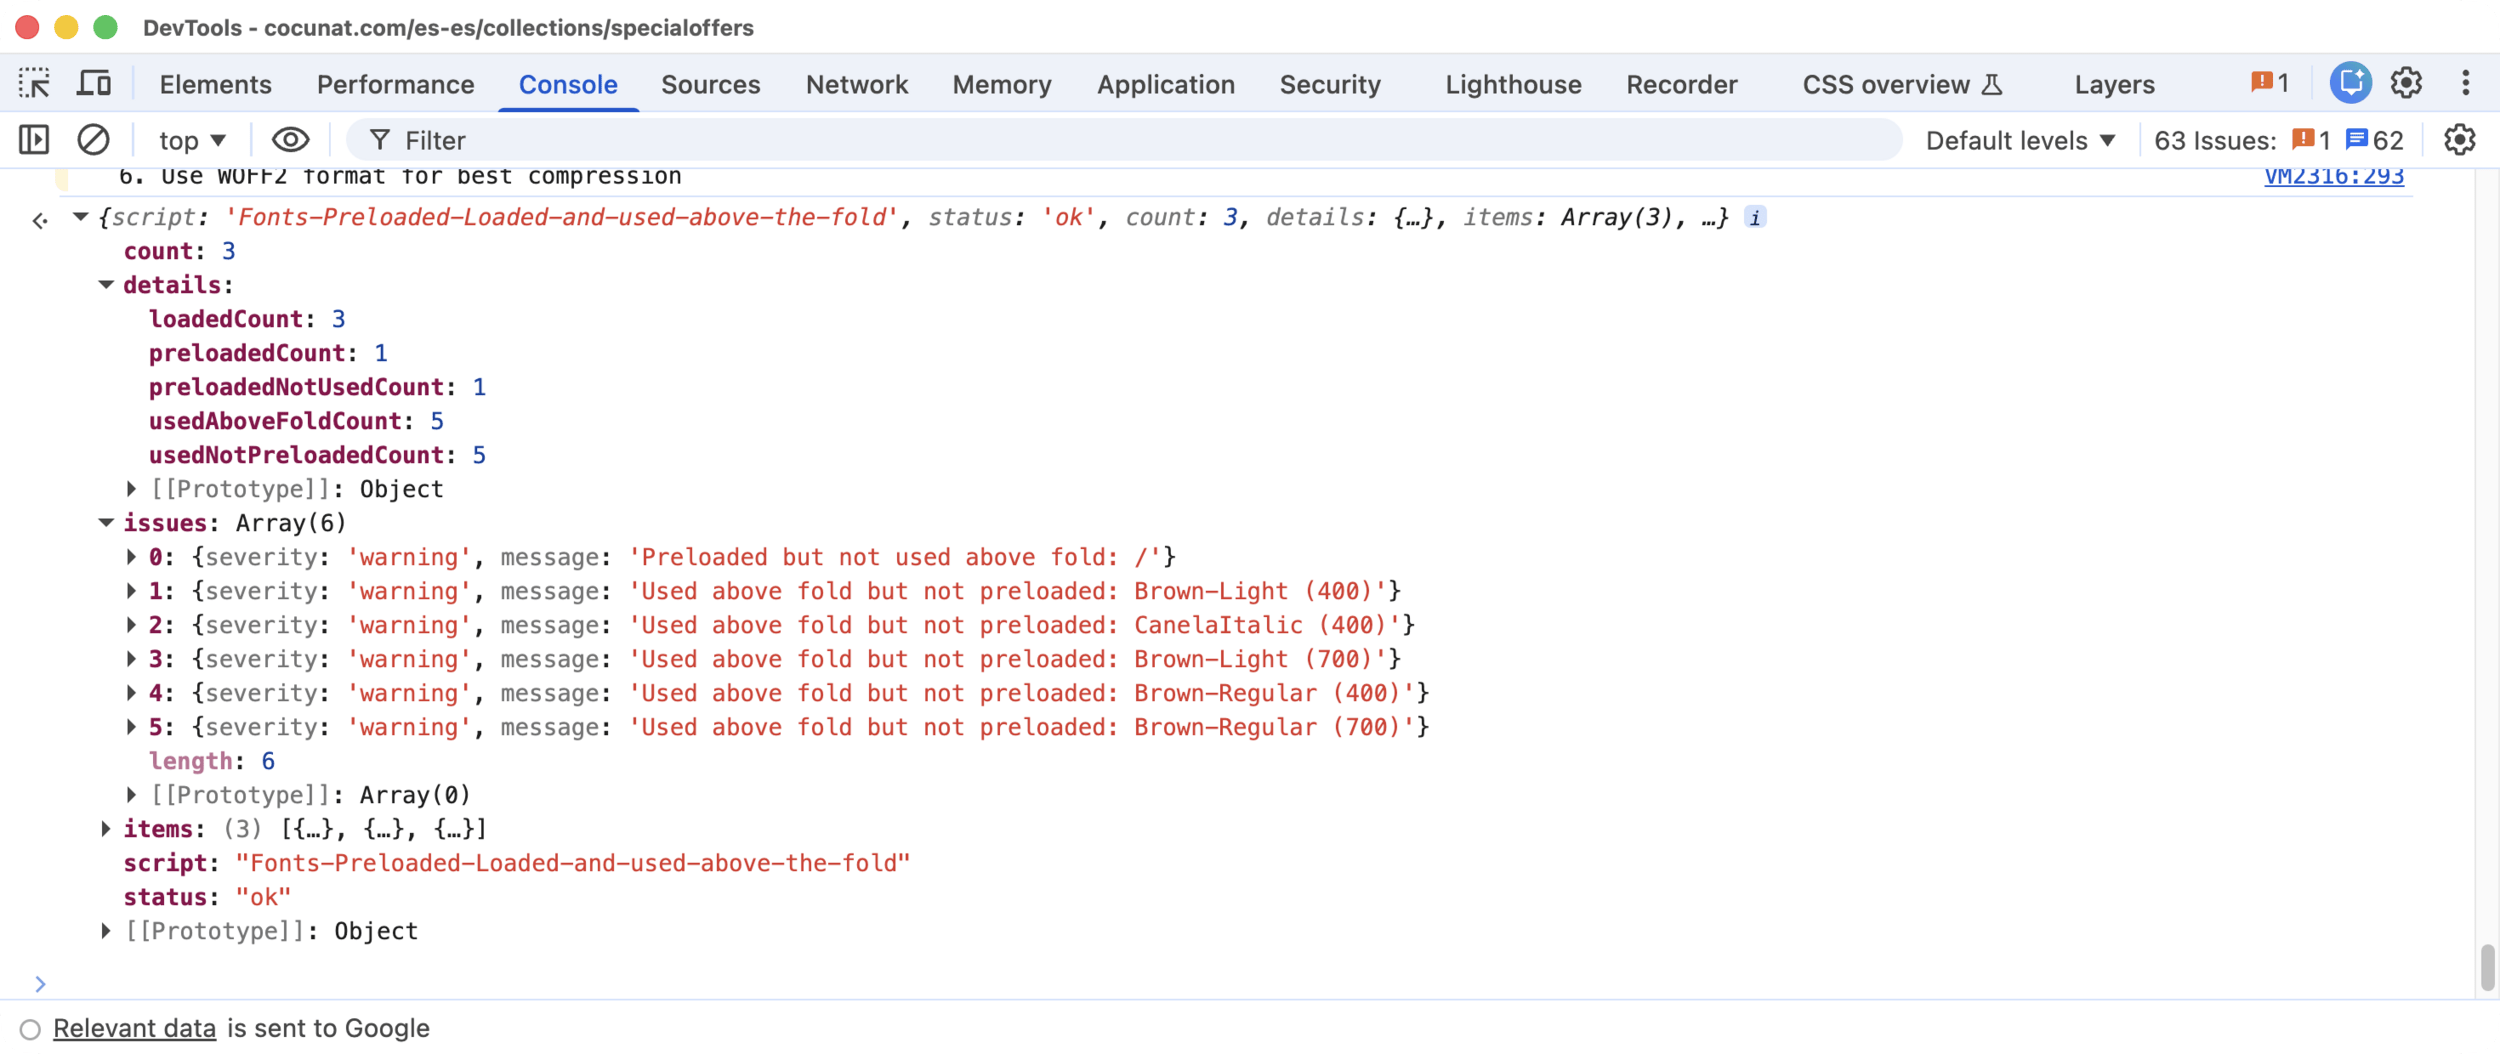
Snippets: Fonts
Fonts Preloaded, Loaded and Used Above the Fold
Cross-references three sources: HTML preloads, `document.fonts` API, viewport elements
Detects: preload without use (consumes bandwidth with no benefit) and use without preload (text renders with fallback until the font arrives)
demo
What the snippets don't replace
The snippets are not a replacement for Lighthouse reports
The Core Web Vitals snippets were created before Chrome DevTools had `web-vitals` built in
Today, DevTools already shows LCP, CLS and INP natively, and with more detail.
For manual auditing in the browser, the CWV snippets are less relevant than they used to be.
Where they still add unique value:
- Image Audit, Fonts, Scripts analyses neither DevTools nor Lighthouse automate
- CLI in CI the CWV snippets let you gate pull requests without opening a browser
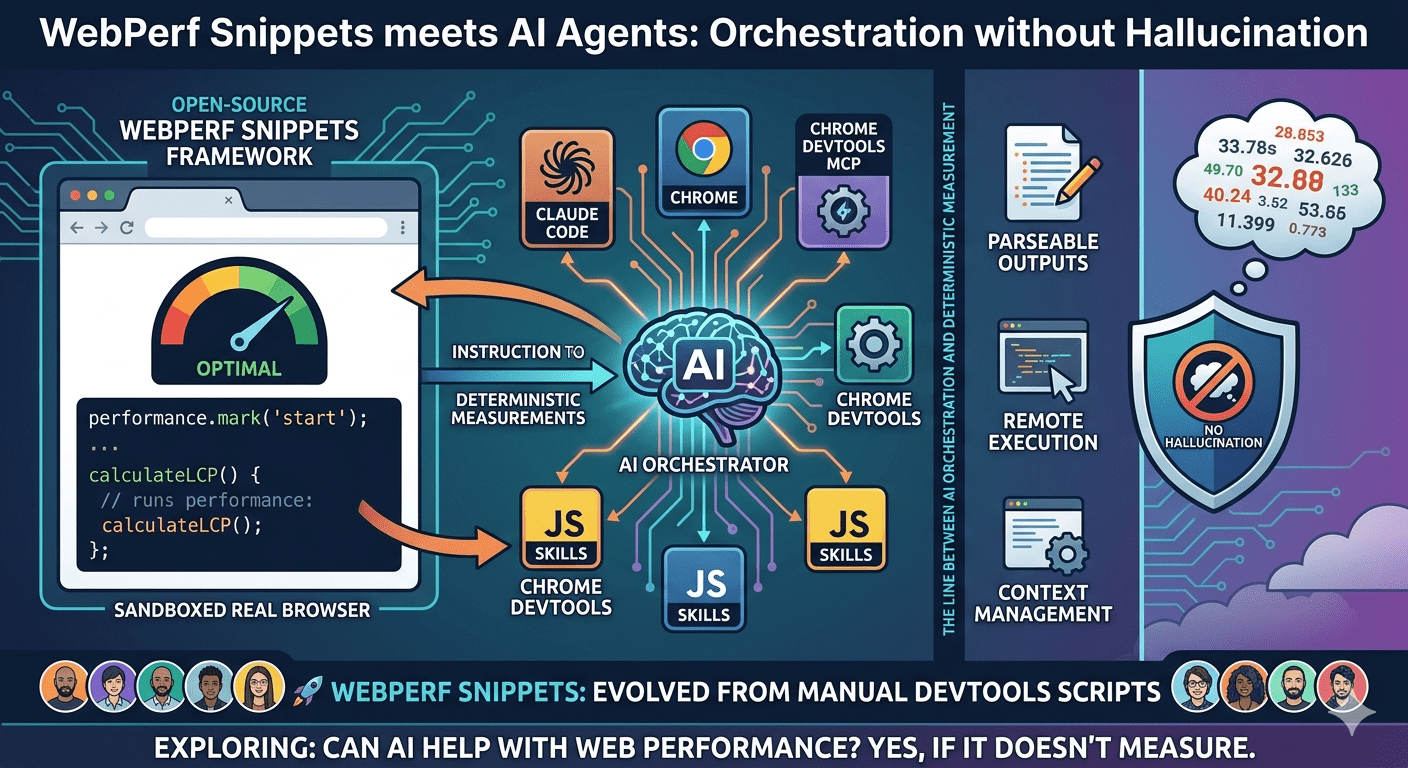
The arrival of AI agents
With agents like Claude Code or Gemini CLI, the workflow changed
I don't always run the scripts myself anymore: I can ask an agent to analyze a page's performance and do it autonomously, using the same scripts as deterministic tools
That raised three problems to solve
Problem 1: Human-readable output
The original snippets wrote console messages designed for human readers: colors, emojis, tables, visual groupings
For an agent, all of that is noise
Parsing console text is brittle. And LLMs can "interpret" text instead of reading it literally, introducing errors in the analysis
LLMs must not measure anything. Only orchestrate.
Solution: structured JSON return
I added a structured JSON return at the end of each script.
{
  "script": "LCP",
  "status": "ok",
  "metric": "LCP",
  "value": 1240,
  "unit": "ms",
  "rating": "good",
  "thresholds": { "good": 2500, "needsImprovement": 4000 },
  "details": {
    "element": "img.hero-image",
    "elementType": "Image",
    "url": "/images/hero.avif",
    "sizePixels": 756000
  }
}
Scripts still write to the console for manual auditors.
But the structured return is what the agent consumes.
For Humans
For Agents
Problem 2: Running JavaScript in the browser
An AI agent has no direct access to the DOM or browser APIs. It needs a bridge.
That bridge is Chrome DevTools MCP: an MCP server that exposes the Chrome DevTools Protocol as tools the agent can invoke.
evaluate_script(script: "...snippet code...")
→ { script: "LCP", status: "ok", value: 1240, rating: "good", ... }
The JavaScript runs exactly as written
No reinterpretation. No adaptation.
Problem 3: Context management
With more than 40 snippets, loading all available knowledge every time the agent activates an analysis tool makes no sense
Loading everything means thousands of tokens consumed per invocation, even if the agent only needs to measure LCP
Solution: WebPerf Skills with progressive disclosure
Scripts organized as Agent SKILLs with three levels of detail the agent loads on demand:
1. Basic level → what each analysis category does
2. Intermediate level → what scripts are available
3. Deep level → the executable code
The agent only reaches the third level when it's actually going to run something
A Core Web Vitals audit consumes a fraction of the context it would use if everything were loaded upfront
Installing WebPerf Skills
From there, the agent can invoke performance analysis on any page open in Chrome
| Agent | Install Path |
|---|---|
| Claude Code | ~/.claude/skills |
| Gemini CLI | ~/.gemini/skills |
npx -y skills add nucliweb/webperf-snippetsdemo
WebPerf Snippets CLI
The same scripts, run headlessly from the terminal.
npx webperf-snippets https://example.com
npx webperf-snippets https://example.com --budget-lcp 2500 --budget-cls 0.1
beta
No DevTools. No agent. Playwright running the same deterministic snippets
The PR fails if LCP exceeds the budget. Core Web Vitals diagnosis in CI
demo
Three ways to use WebPerf Snippets
| Who | How | Where |
|---|---|---|
| Technical | Directly in DevTools | webperf-snippets.nucliweb.net |
| CI / Terminal | Headless CLI via Playwright | npx webperf-snippets <url> (coming soon) |
| AI agent | As WebPerf Skills via Chrome DevTools MCP | npx -y skills add nucliweb/webperf-snippets |
The line that must not be crossed
Deterministic measurement ←→ LLM analysis
The LLM does not measure. The LLM orchestrates
JavaScript scripts run in the real browser, with real data
The agent receives the structured JSON and reasons over it
If the LLM measured, it would hallucinate.
Because LLMs cannot open DevTools.
In summary
What started as scripts to avoid repeating myself in audits ended up being:
The starting point has always been the same: a JavaScript script that measures something specific in the browser, precisely and without depending on external tools
- An open source collection with a community
- A website with each snippet thoroughly documented: overview, real-world examples, framework-specific guidance, Core Web Vitals impact…
- A CLI to automate audits in CI
- Tools for AI agents with real measurements
Gràcies
- Snippets: webperf-snippets.nucliweb.net
- Repo: github.com/nucliweb/webperf-snippet
- CLI: github.com/nucliweb/webperf-snippets/pull/73
- Skills:
npx -y skills add nucliweb/webperf-snippets - Posts: joanleon.dev/posts/webperf-snippets-agent-skills/