COMP1531
Software Operations
Presented by Atlassian

In this lecture
- Once we've built the software, how do we keep it running day-to-day?
- How do we understand and observe our software running in a production (real-world) environment?
- What are the tools we use to operate software?
- What are the processes we use to operate software?
Building it was the easy part
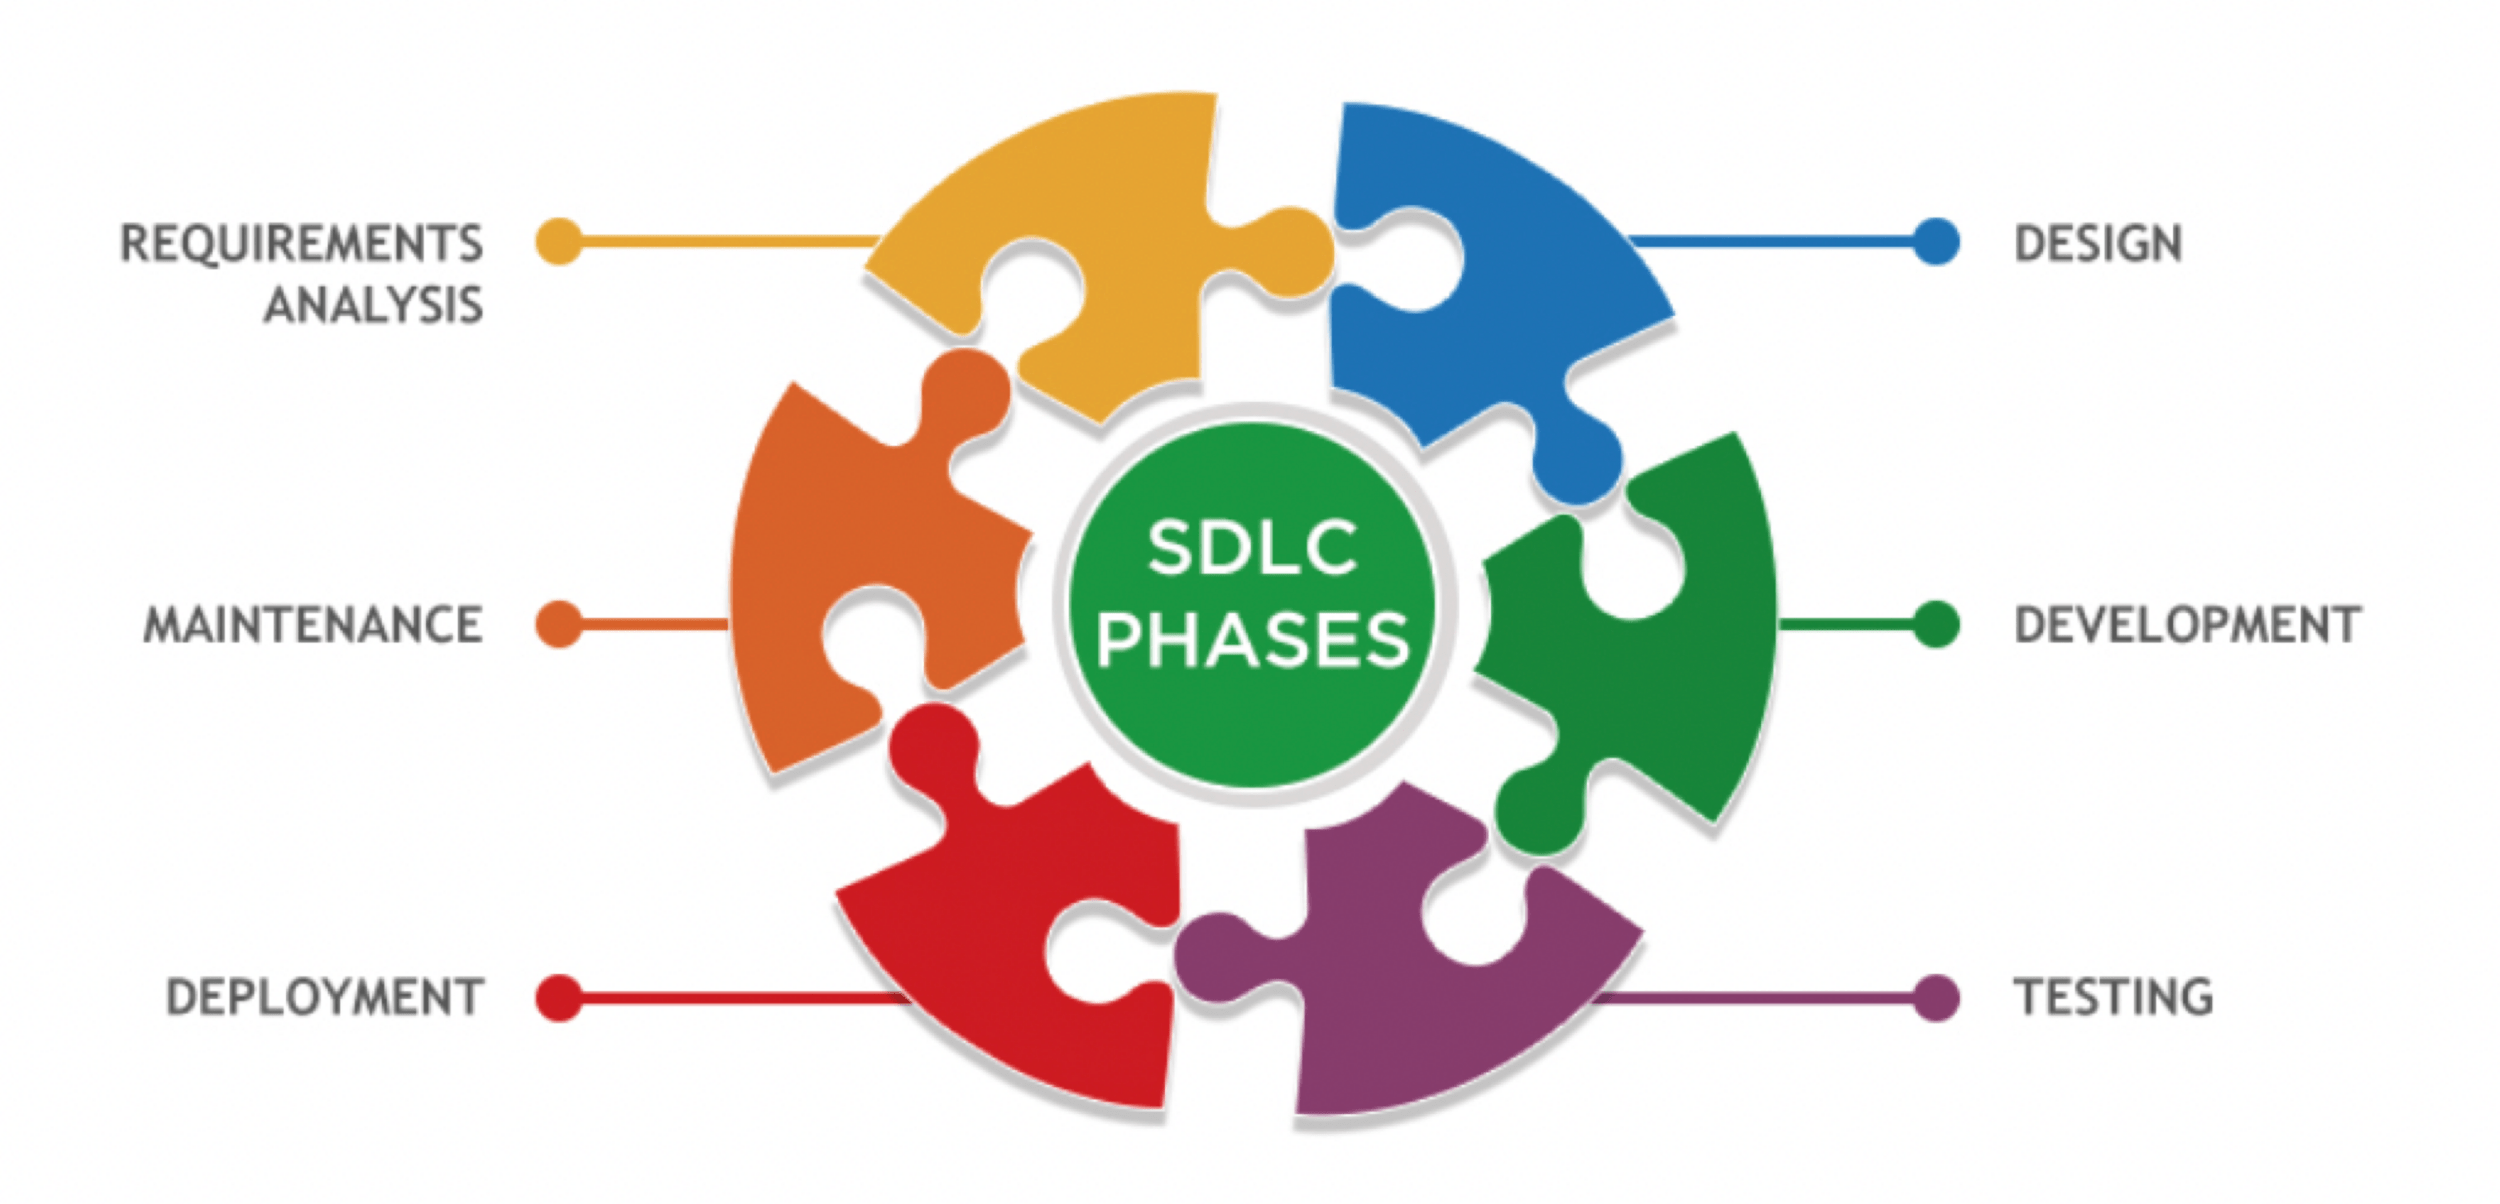
We discussed maintenance previously, but we mainly discussed it in terms of how we design and develop software.
Maintenance isn't just building new features; it's about keeping the existing ones running smoothly.
Software Operations
Software operations is a very broad subsection of Software Engineering.
"The goal of software operations is to ensure that applications function reliably, are available when needed, and continue to meet user requirements over time" - IEEE Computer Society.
Aspects of software operations include:
- Ensuring the software is always available
- Has my system crashed? Are users able to access it?
- Ensuring the software is consistently reliable and performant?
- Reliability: Are the users receiving valid responses?
- Performance: Is my software working in a reasonable time frame? (e.g. 1-2s)
- Monitoring and diagnosing errors
- Are my API endpoints returning 5XX status codes?
- Do the users see error screens?
- Ensuring the software stays secure
- Monitoring costs of operating the software (e.g. hosting costs)
How do I know if my software is working?
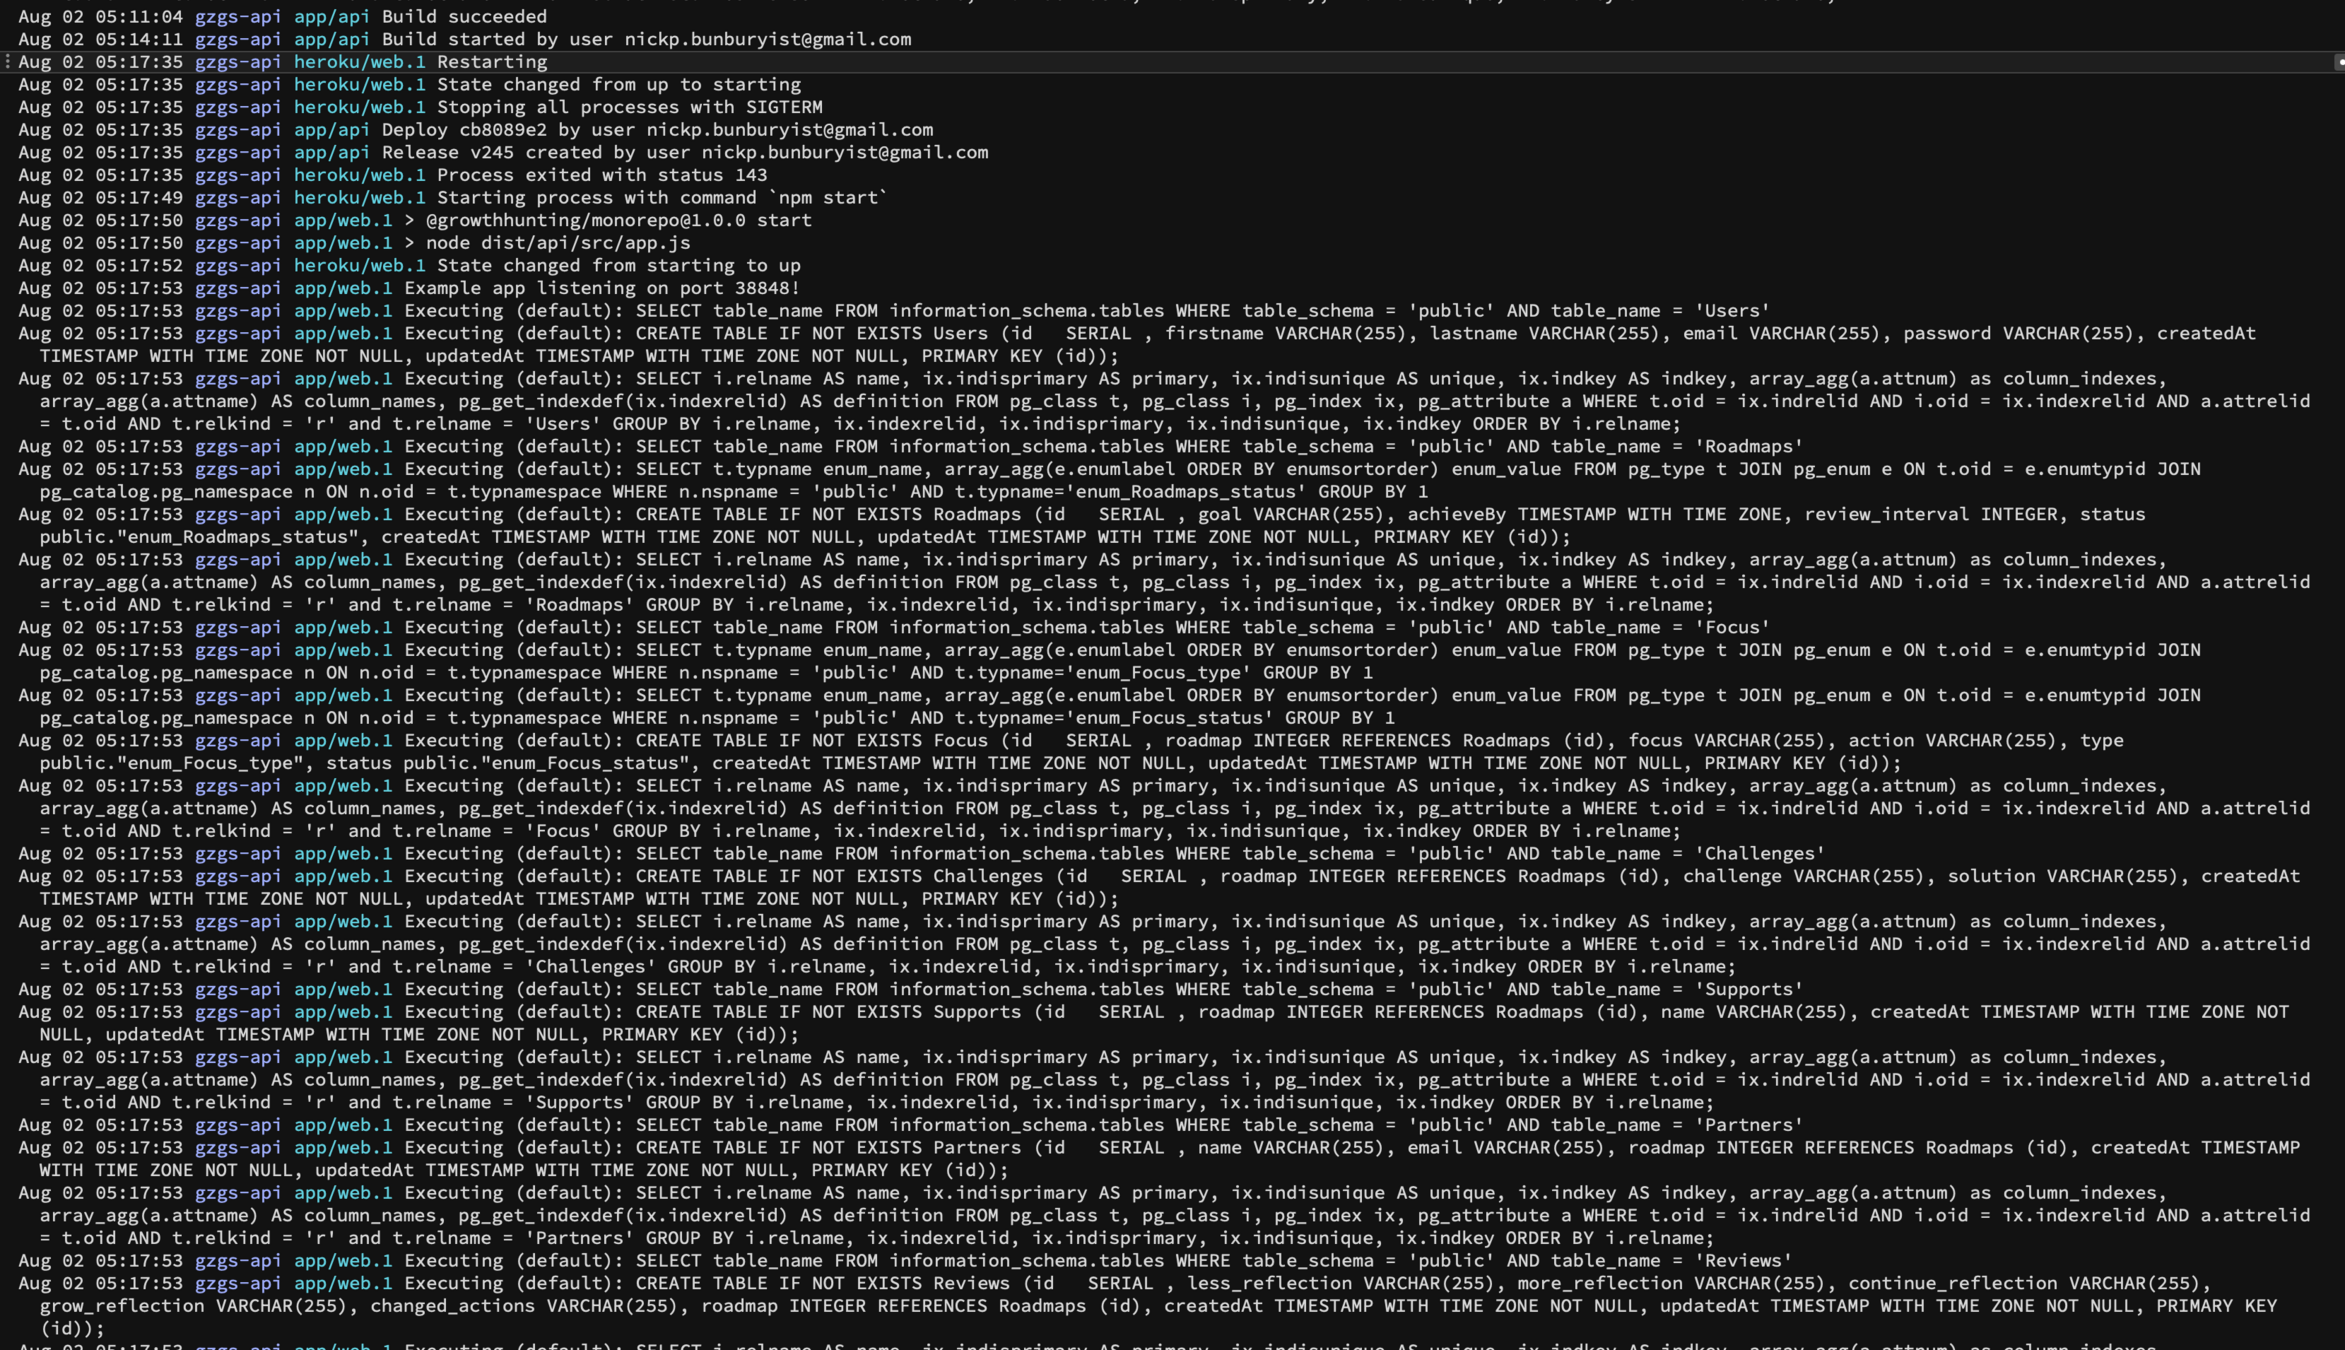
At a basic level, what you use to check whether software is working in production is the same as what would use if you were running it locally - logs and errors.
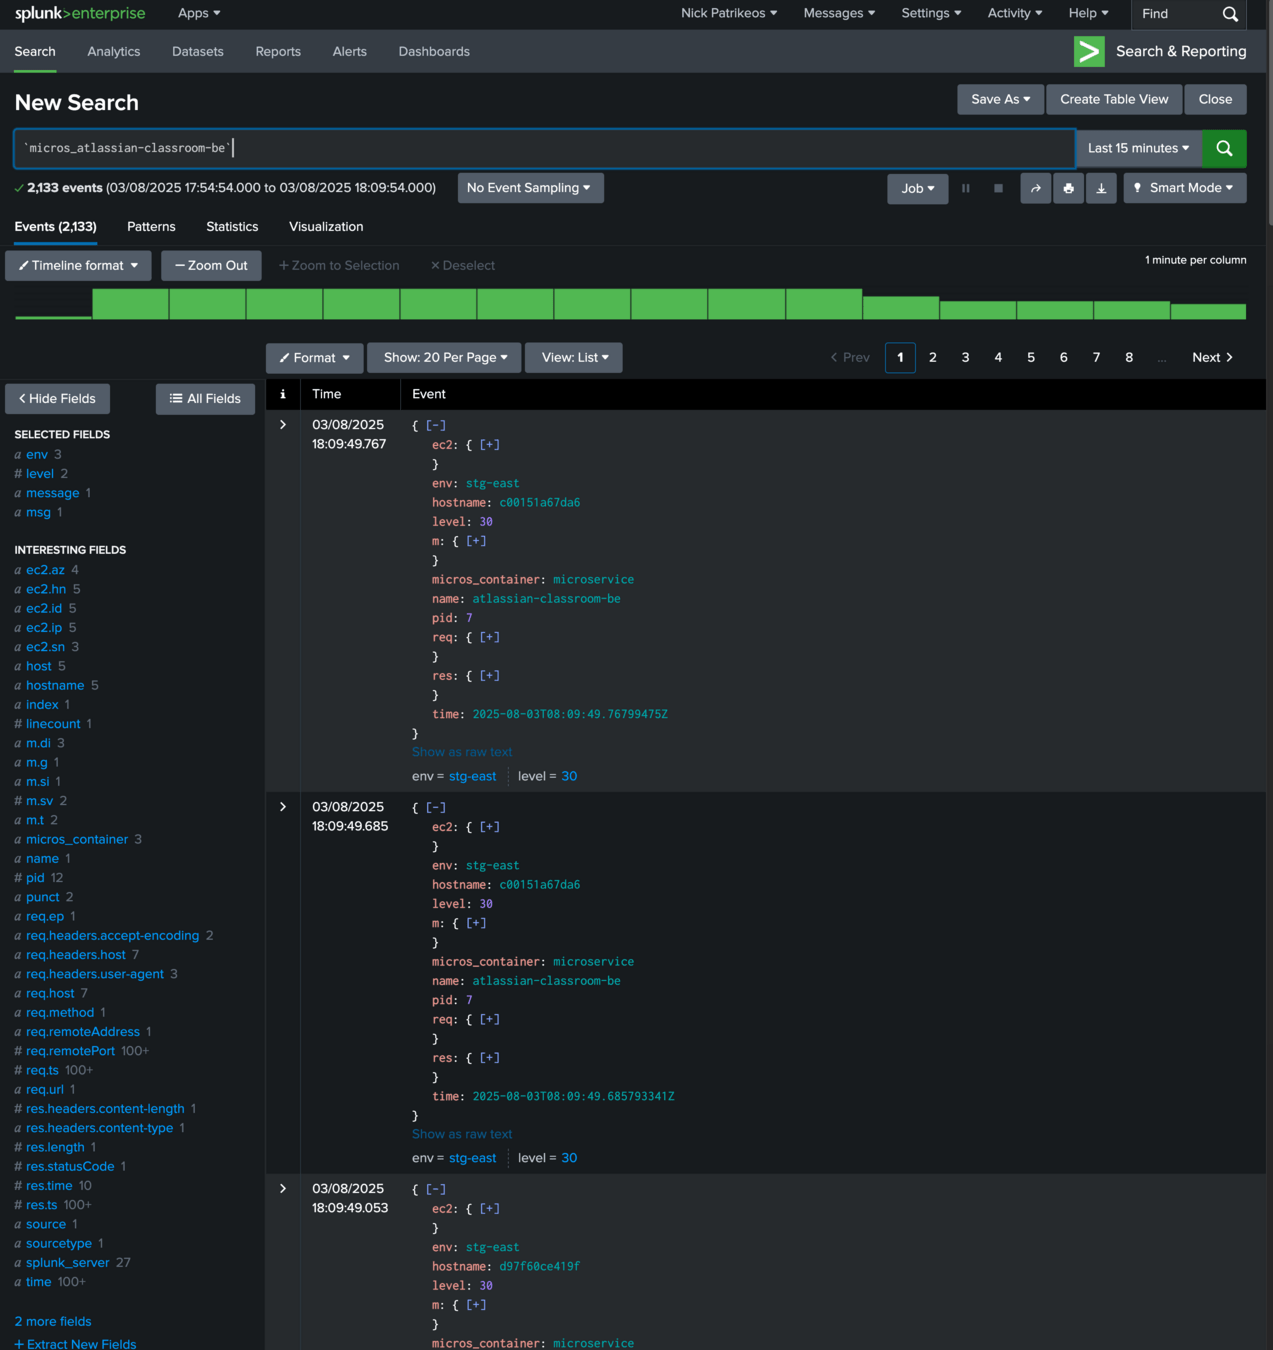
Logging
How you access the logs for your production application depends on the deployment provider.
Other factors, like how long the logs last for also depend on the deployment provider.
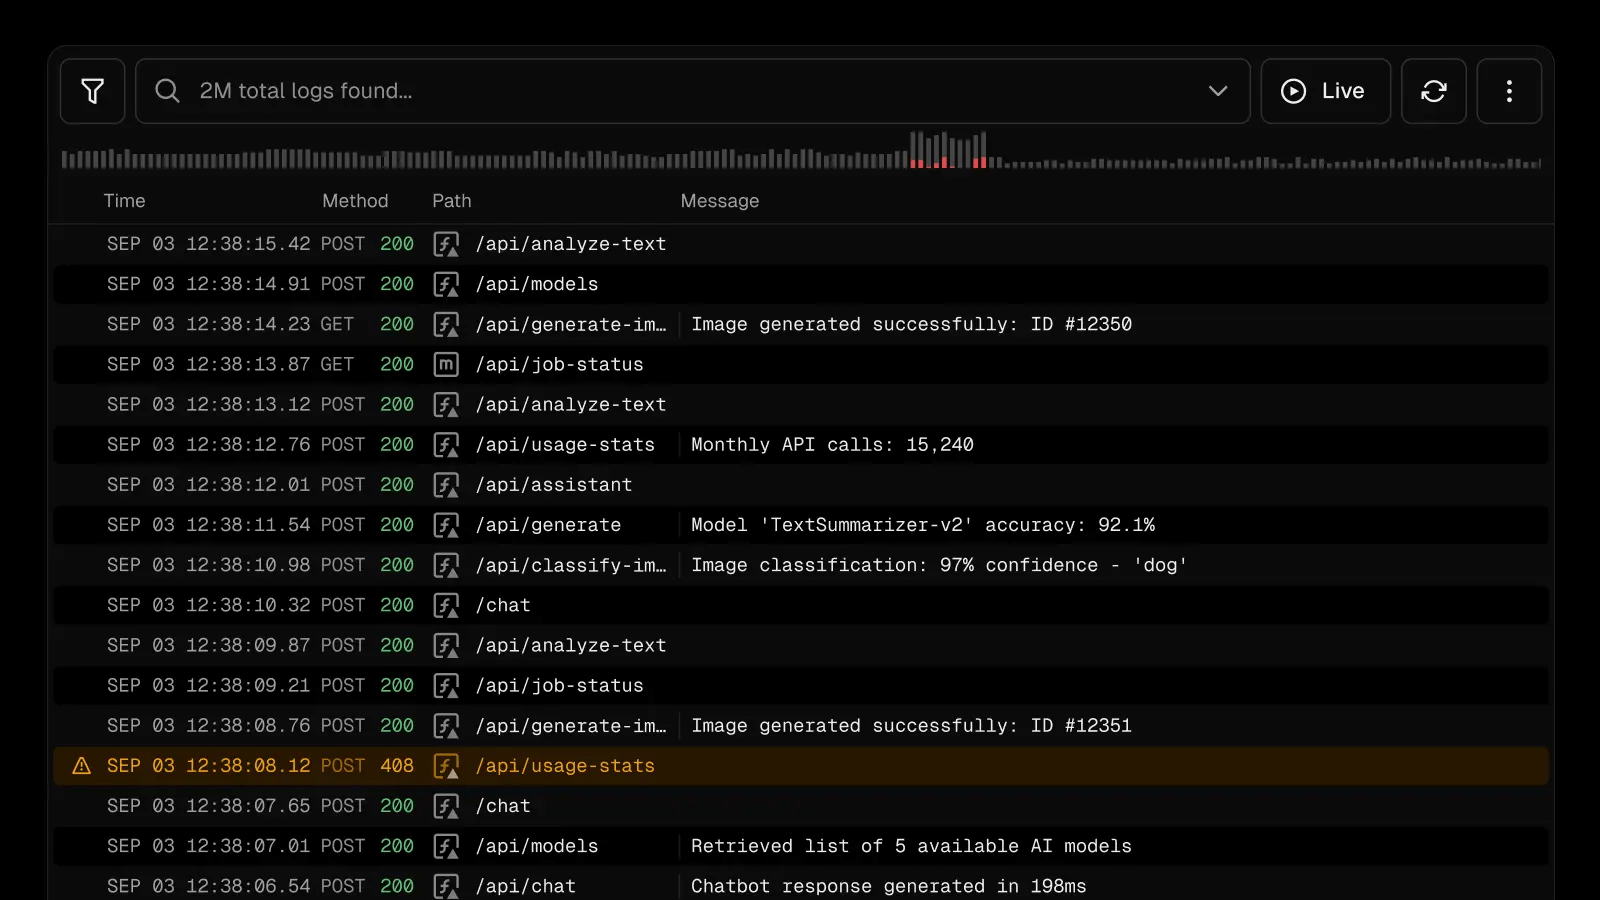
Debugging with Logs
Using logs, you can diagnose errors with your software in production as you would locally.

But what if there are lots, and lots of logs...?
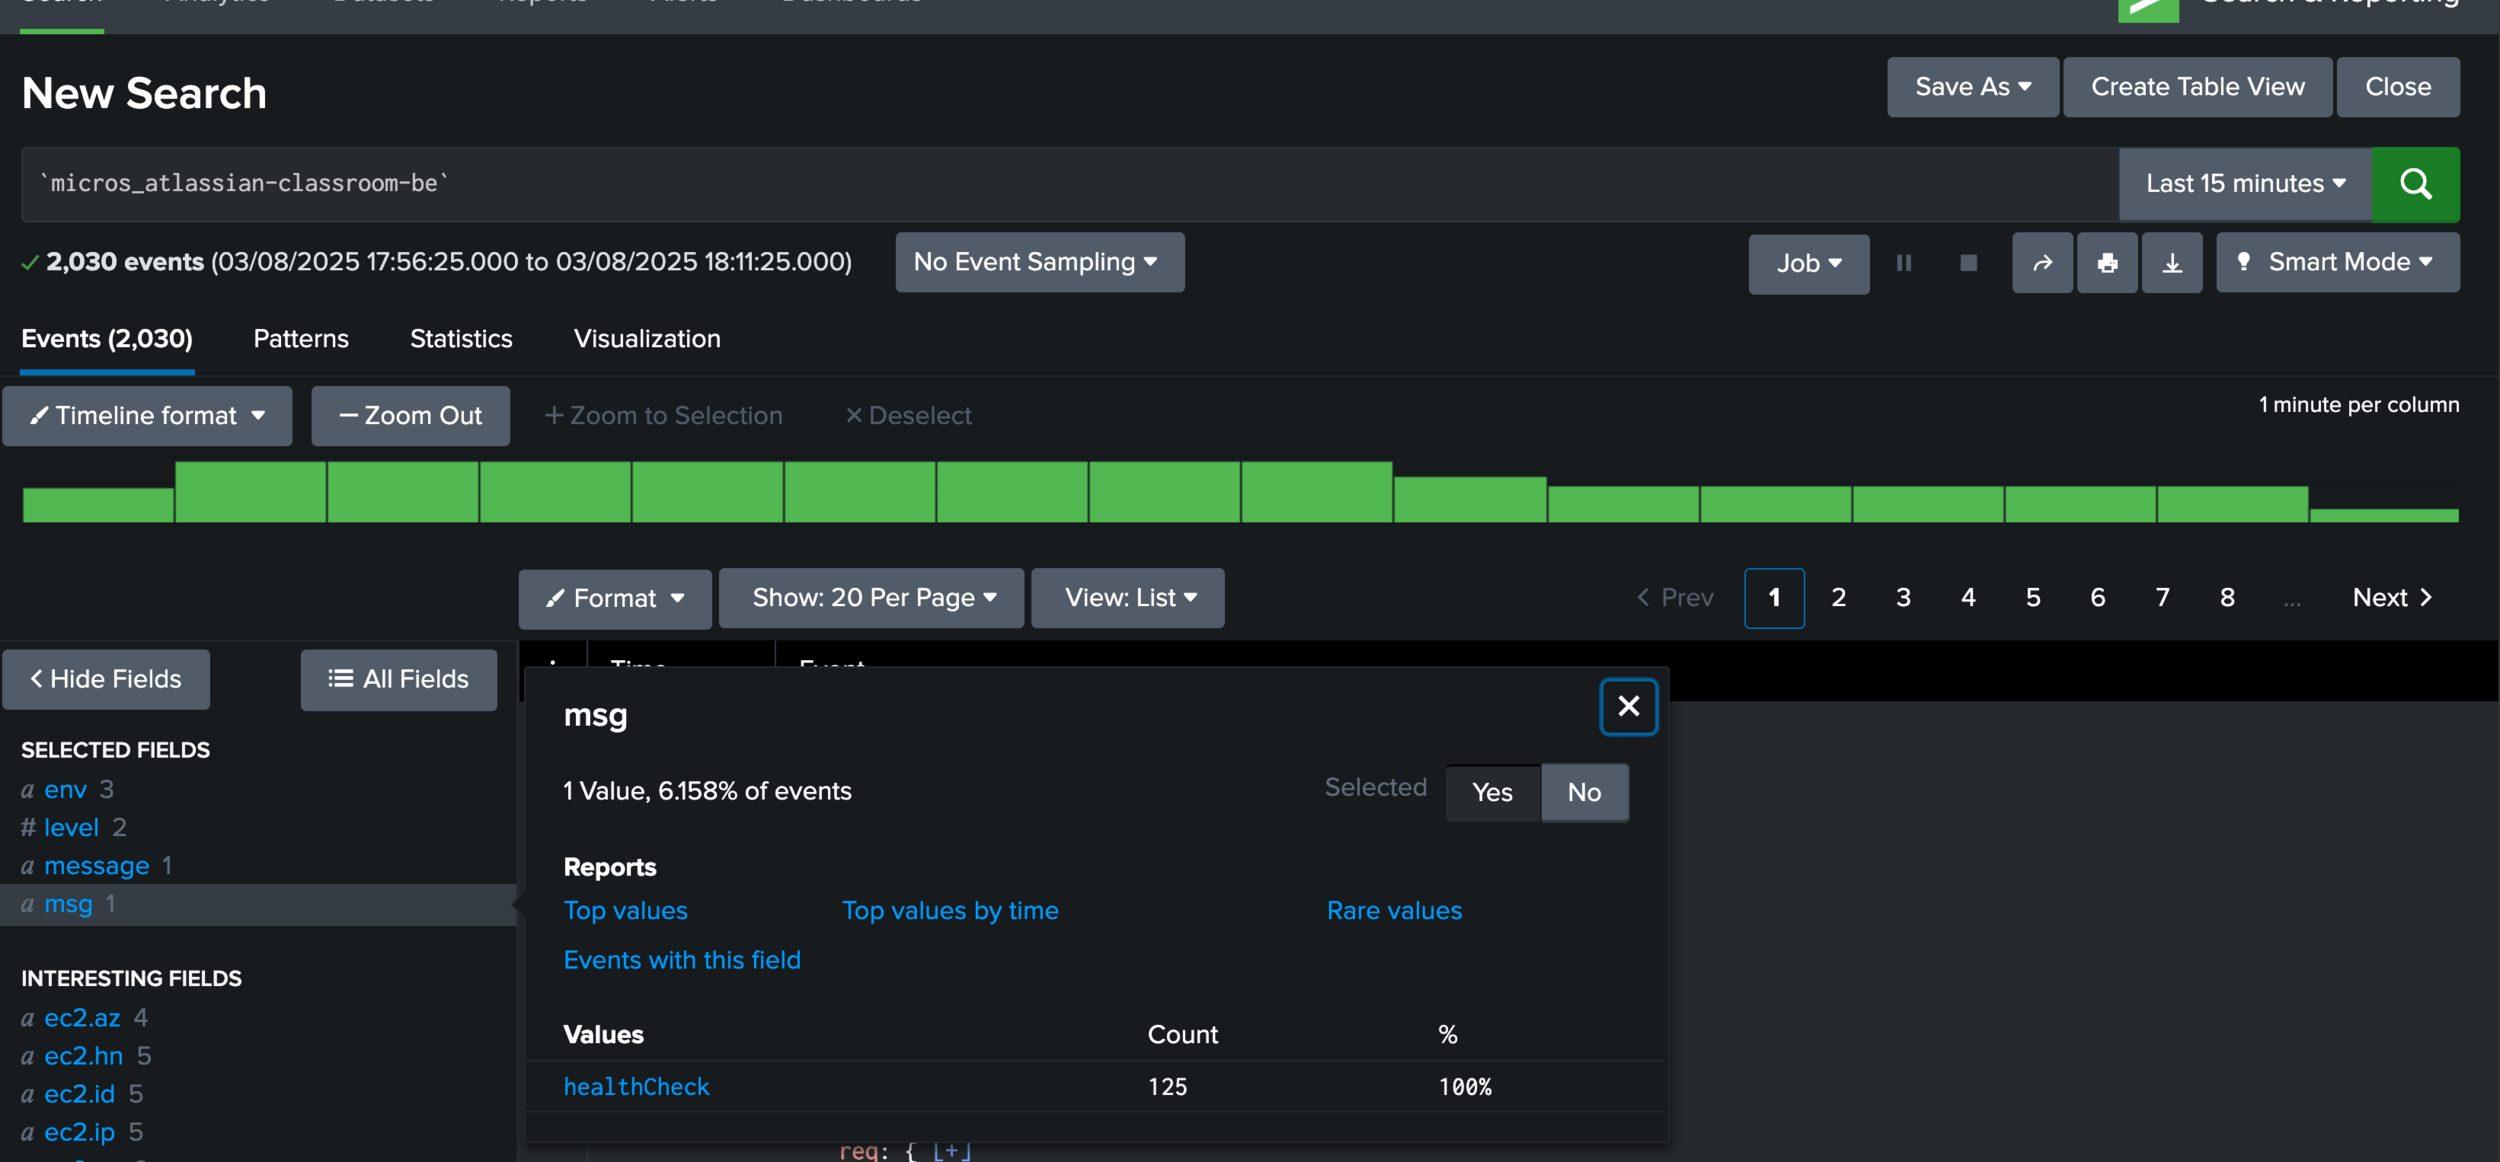
Structured Logging
These logs are structured using OpenTelemetry, a common standard that defines log structure make logs easily searchable at large scales.
How do I know if my software is working, with numbers?
Sometimes, we just want to know how we are performing in aggregate - without getting into specific details.
Metrics allow us to measure specific values that we care about and build real-time charts showing us these numbers.
Metrics help us answer questions like:
- How many 5XX errors has my API had in the last 24 hours?
- How many successful (2XX) requests has my API had in the last 24 hours?
- How many users purchased item XYZ?
- How many database writes did my API perform?
Some of these values are provided to you by your deployment provider - others, you need to instrument yourself.
Metrics
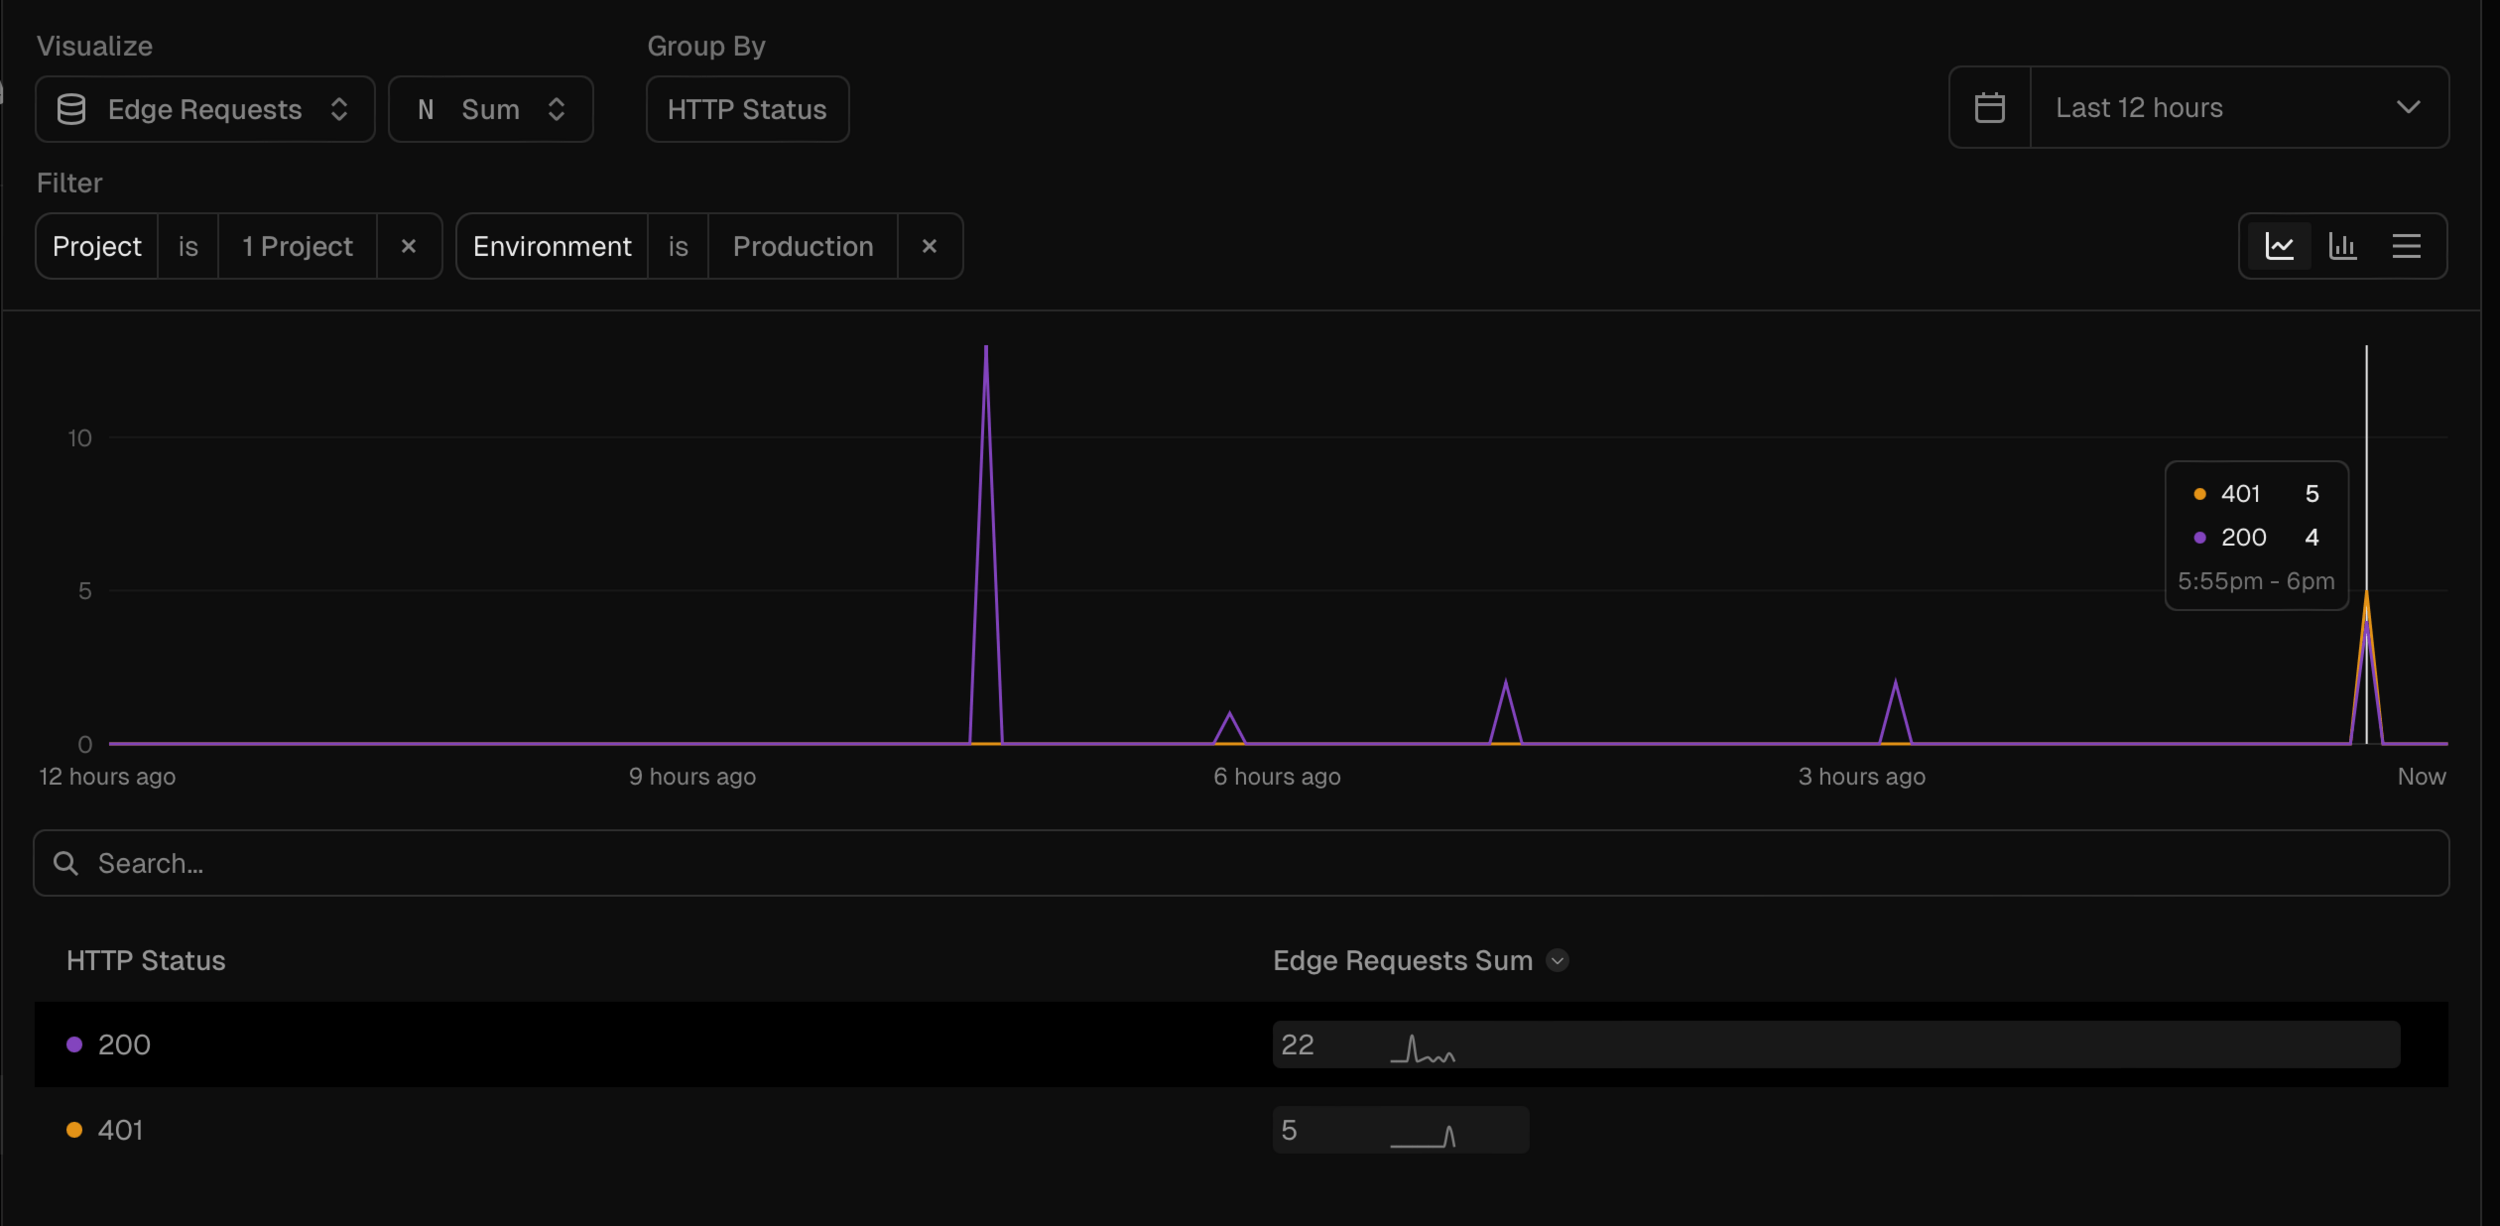
This chart is showing a series of requests made, by HTTP status code.
The ability to visualise how our software is operating helps us understand it much better, particularly as traffic grows.
Instrumenting Metrics
This is what the code to instrument the numbers behind this chart might look like:
type Metrics = {
	increment: (metric: string, params: unknown) => void
}

function askLLM(question: string, metrics: Metrics) {
  // blah blah blah

  // Make an call to the LLM API
  const answer = llmApiCall(question)
  // Increment the metric 'llm-api-call', noting the status code
  metrics.increment('llm-api-call', { status: answer.response.status })

  return answer;
}
Detecting if things go wrong
Rather than having to manually check the metrics every day, we can use tools to automatically notify us when there are spikes in metrics we don't consider normal
alarm.when(error5xx.count>=100).over('60m')It's important to think properly about what constitutes "normal" for your software's behaviour.
E.g. is it a good idea to set an alarm every time there is a 403 error from your API?
Setting up metrics and alarms
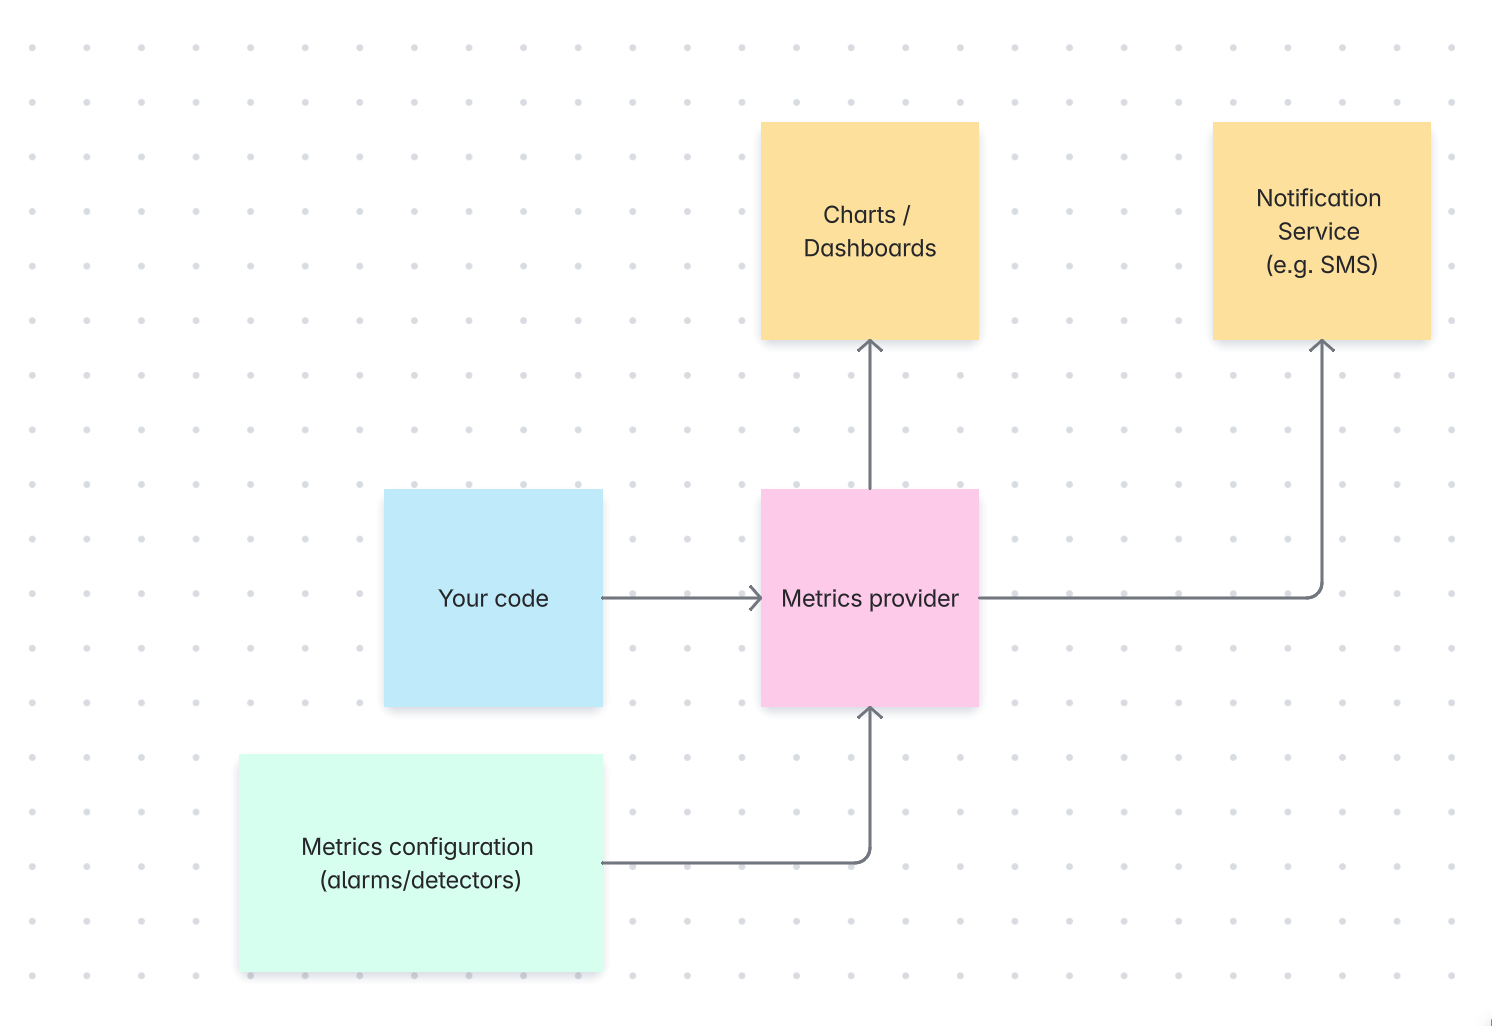
Observability
Observability is the formal term for what we've been discussing.
Observability is the ability to understand a system's internal state by examining its external outputs (logs, metrics and traces).
Some popular observability tools include:
- Splunk (used at Atlassian)
- NewRelic
- Grafana
- DataDog
How do we measure overall operation?
When there is a lot of traffic, which is constantly changing, it can be hard to know how to configure alarms/detectors to let us know when things are going wrong.
Software will always have errors, or timeouts, or other anomalous conditions. Instead of fixing every possible error, we want to have everything work as expected most of the time.
How you define "most" depends on the amount of risk you are willing to tolerate.
That's why, at large scales, we typically measure overall operations as a percentage (%).
We also measure based on user-centric experiences (user stories).
For example: What percent of users were successfully able to create a quiz question?
Service Level Objectives (SLOs)
Traditionally in a EULA (End User License Agreement) there will be a series of SLAs - Service Level Agreements.
In these SLAs, the company/service makes promises to the customer such as "We guarantee that our LLM API will be available 99.99% of the time".
Each SLA maps to an SLO - Service Level Objective which is important for the service to measure and monitor.
Service Level Objectives are capabilities that the service provides to a customer that must function as expected for a % of the time.

Service Level Objectives (SLOs)
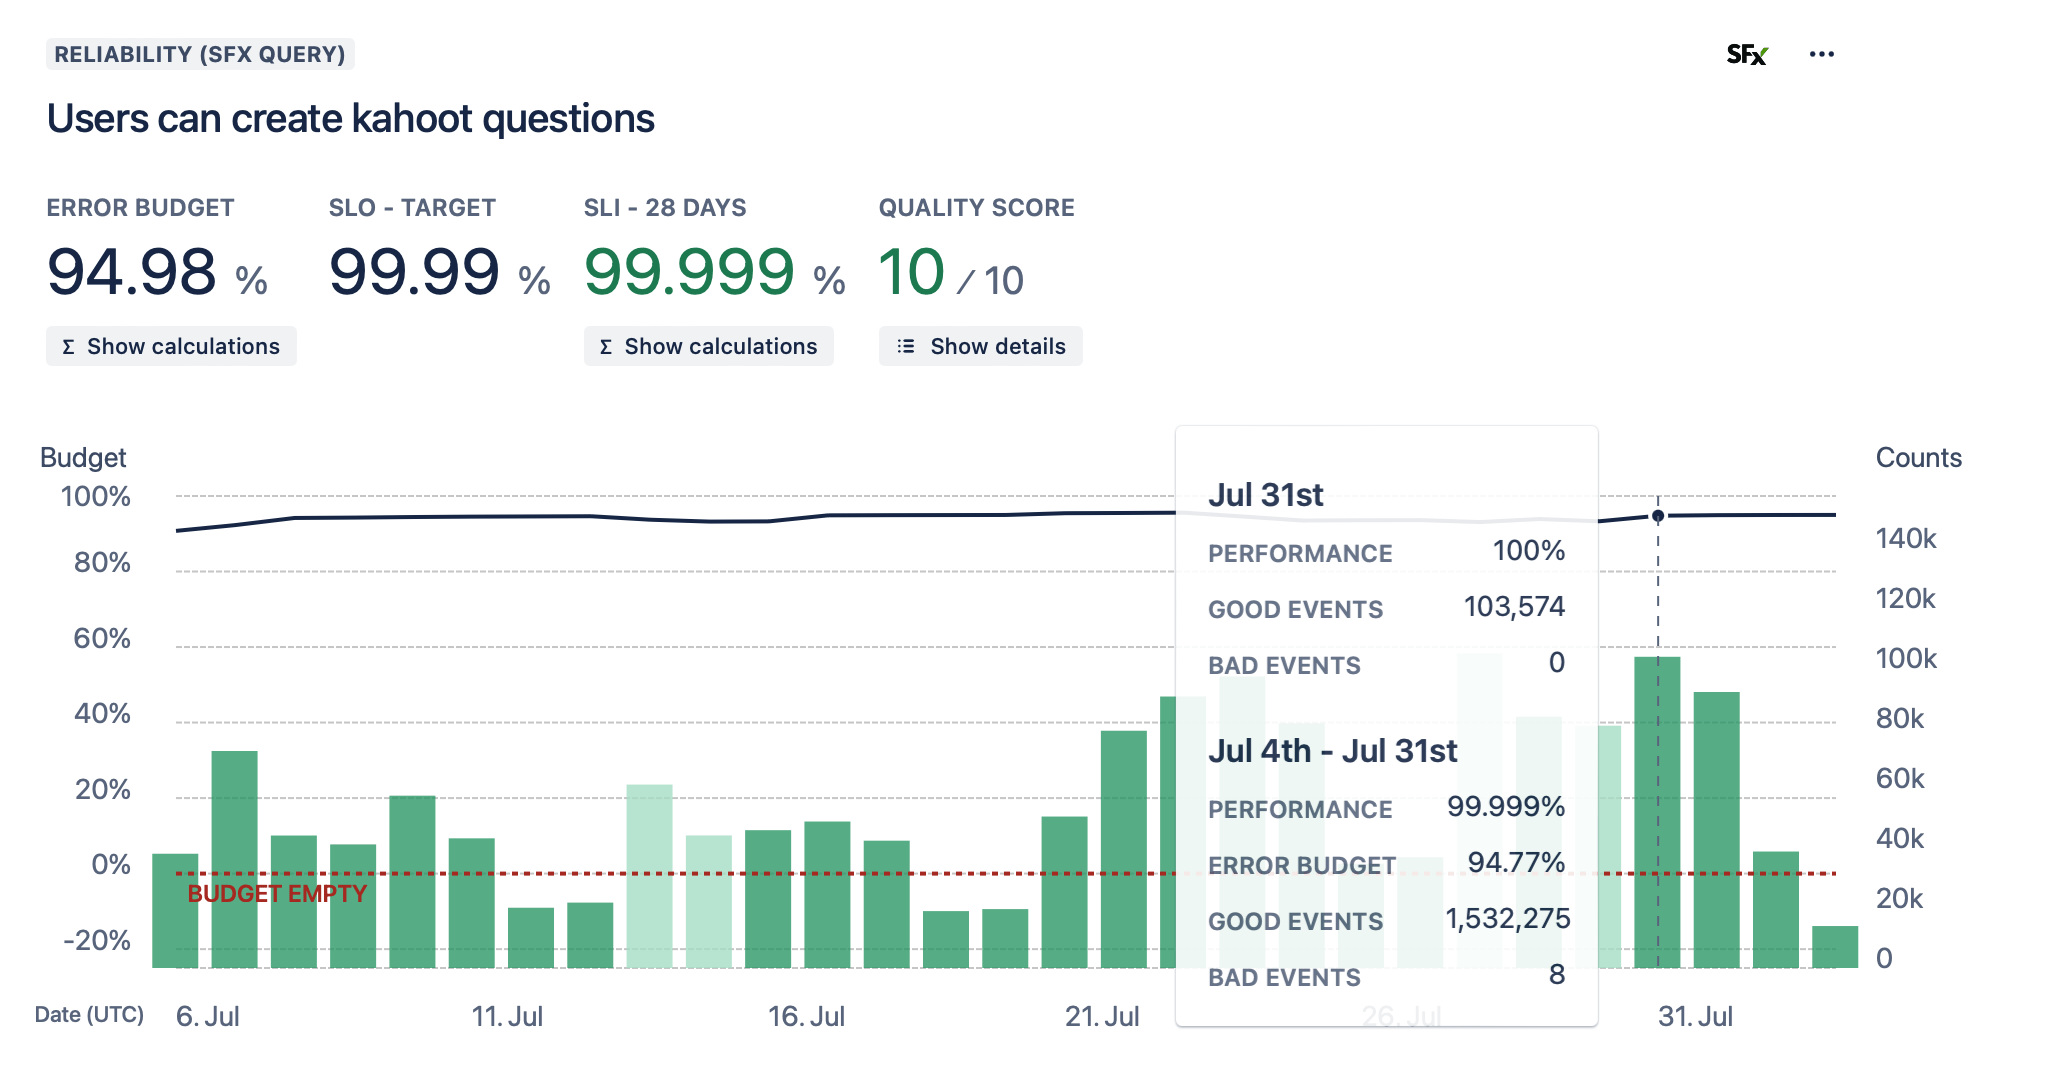
Service Level Objectives (SLOs)
type Metrics = {
	increment: (metric: string, params: unknown) => void
}

function createKahoot(metrics: Metrics) {
	try {
      // Create the kahoot
      // ...

      // Kahoot was created successfully
      metrics.increment('kahoot-create-success')
    } catch {
      // Kahoot failed to create
      metrics.increment('kahoot-create-failed')
    }
}
Service Level Objectives (SLOs)
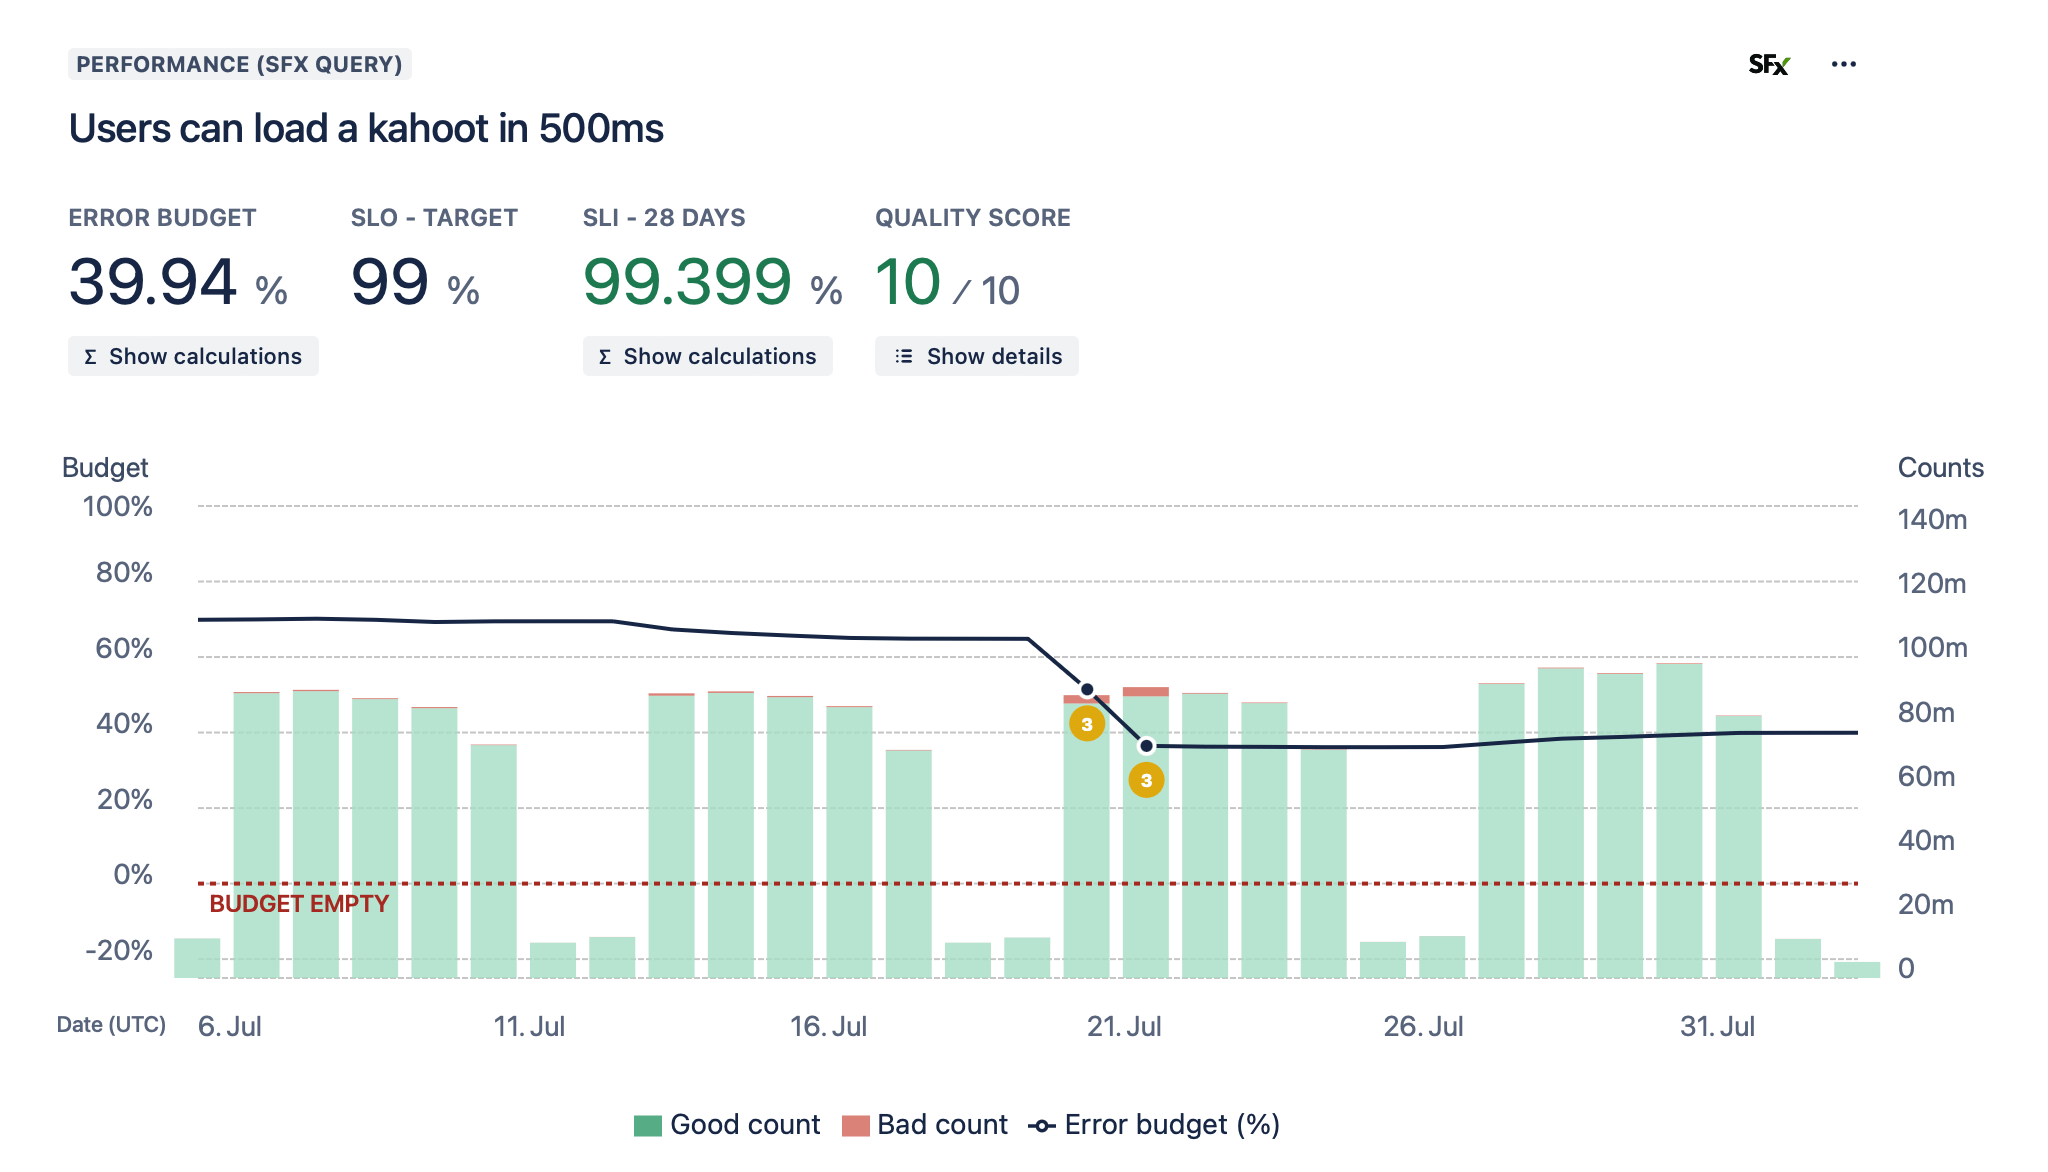
Service Level Objectives (SLOs)
type Metrics = {
  timer: (metric: string) => void
}

function loadKahootWithMetrics(metrics: Metrics) {
	const timer = metrics.timer('load-kahoot')

  	// Wrap the function call in a timer
  	// so we know how long it took
 	timer.start()

  	loadKahoot()

  	timer.finish()
}
How do we operate software as a team?
How you operate your software will depend entirely on how the software is expected to be used by your customers.
For example, a trading company does not need to operate its software 24/7 - it only needs to make sure it works during trading hours.
Technology that is expected to have 24/7 uptime (i.e. it is used globally, or by users at all times) will often have a corresponding operation schedule.
This brings with it a series of rituals:
- On call
- Runbooks
- Techops meetings / Oncall handover
- Incident Management
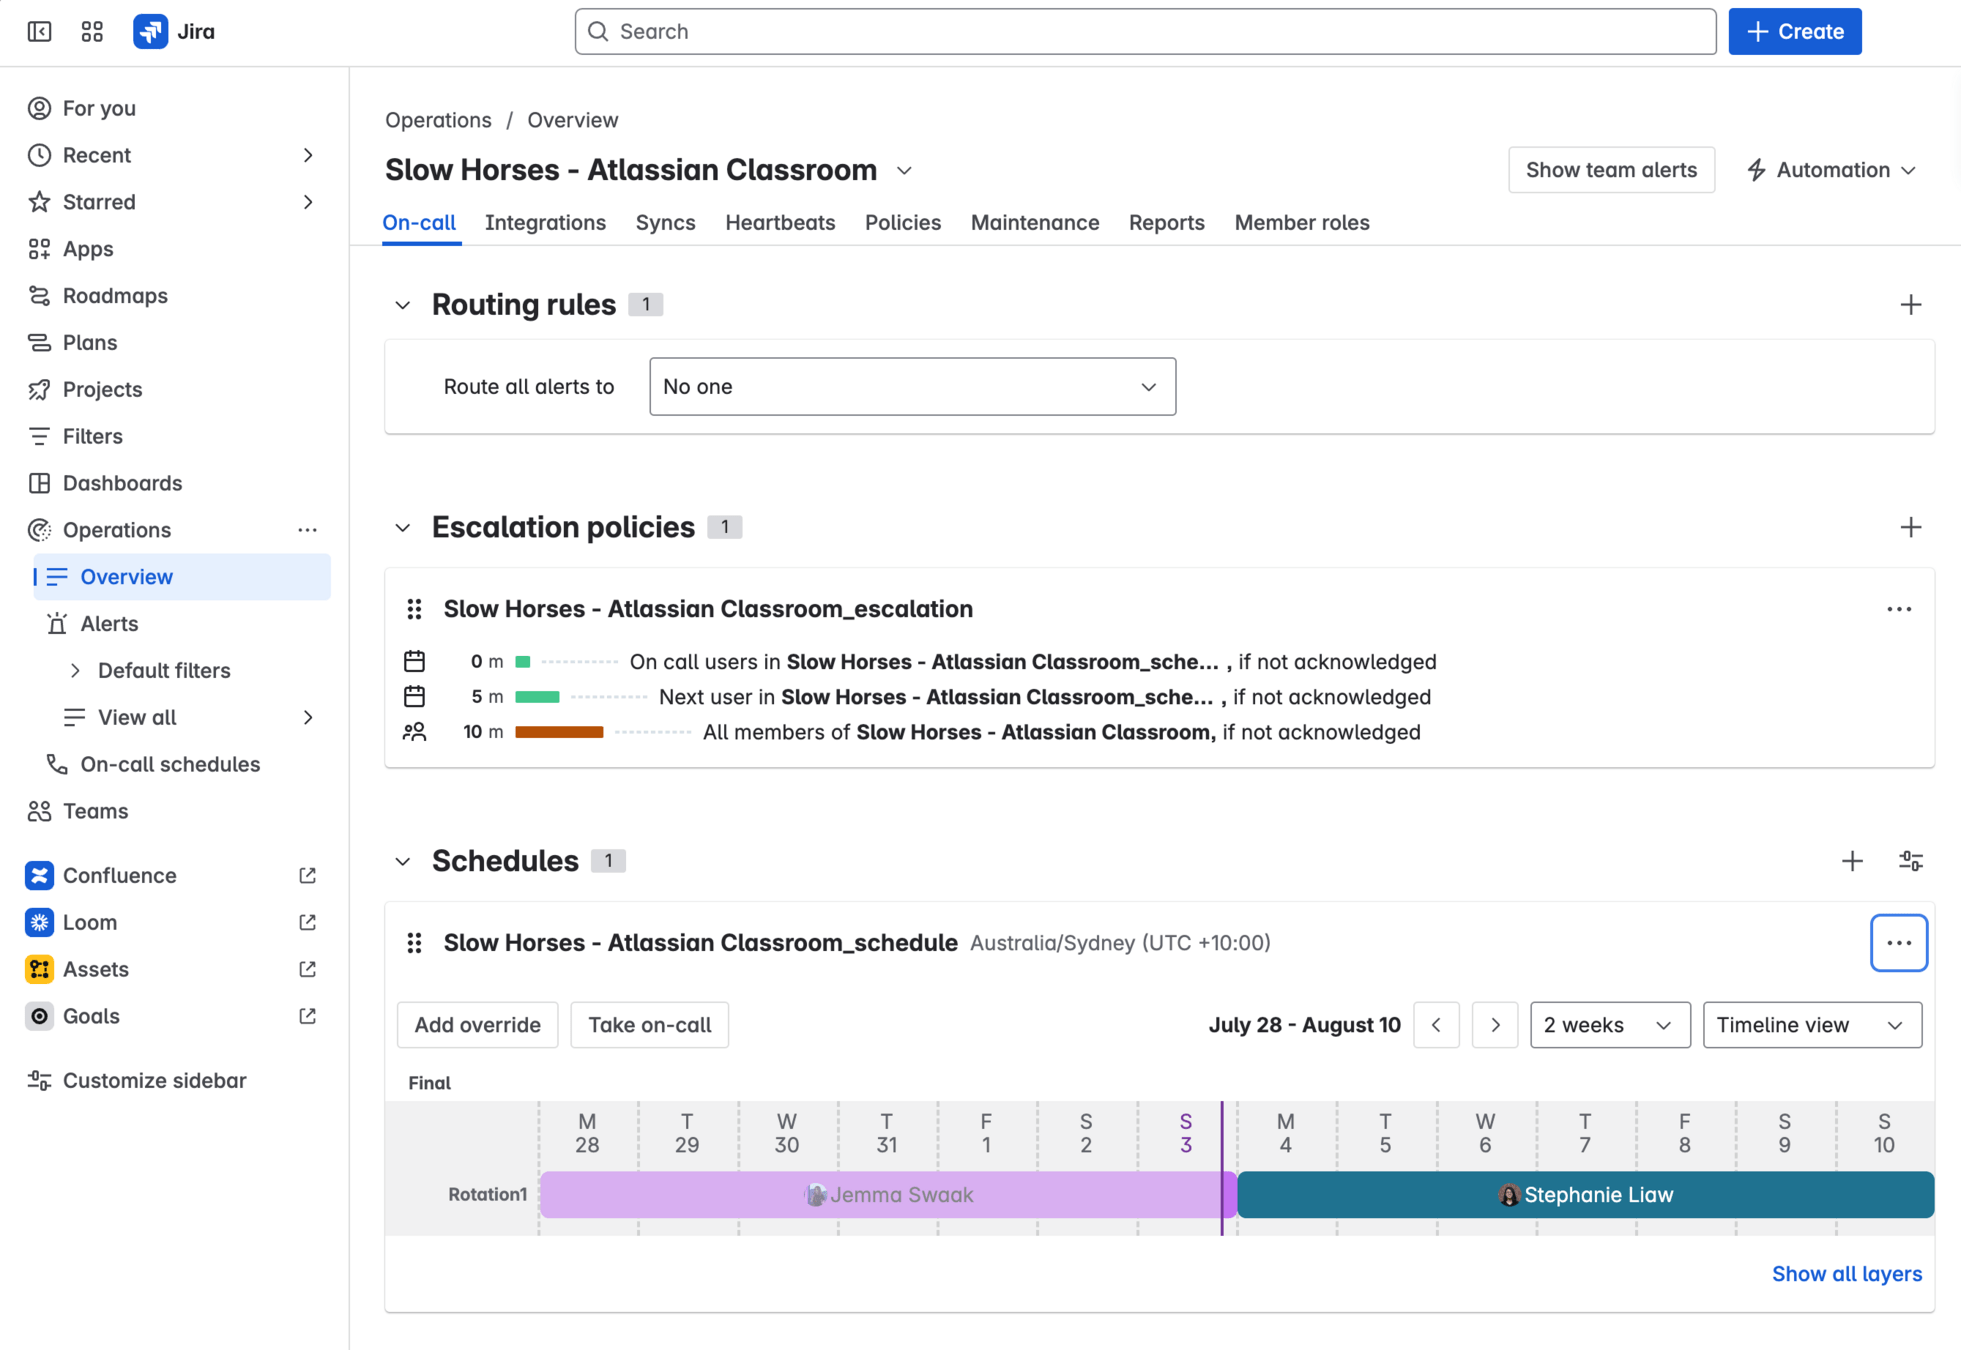
On call
If you are a company that cares about having its software work consistently, then you probably need to pay someone to be on call 24/7 in case things break.
When the stakes are lower, you can afford to leave issues to the next working day. Sometimes it is worth waking someone up at 3am to fix an issue though!
Atlassian provides a tool for on-call operations called Jira Service Management.
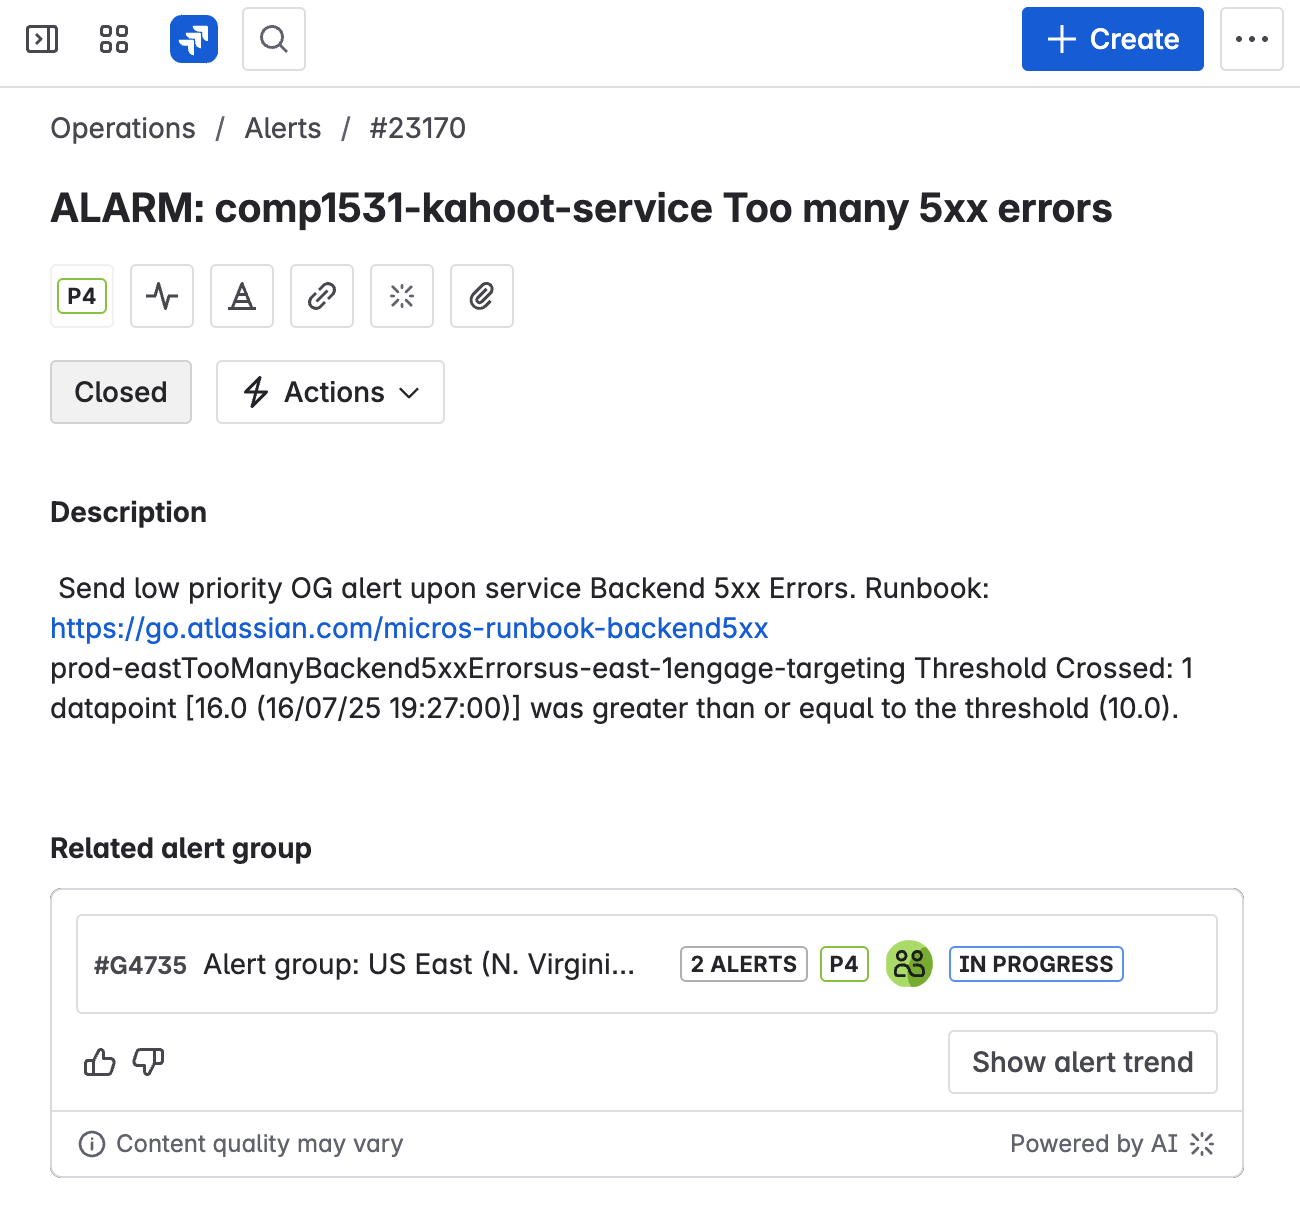
Sound the alarm!
The on call engineer is notified on conditions such as:
- An alarm has triggered (e.g. the API has started receiving an abnormal amount of 5XX requests)
- An SLO is breaching or burning (e.g. users can no longer reliably create kahoot questions)
- Customers start complaining about degraded experiences
Different issues have different priorities (P-levels):
- P1/P2: The issue is urgent and needs to be investigated right now. Wake the on call engineer up if needed. Call them on their phone.
- P3/P4: The issue is not urgent but should be investigated during working hours. Send the on call engineer a text / email / notification.
Sound the alarm!
The on call engineer's job is to:
- Understand the scope of the issue - is it a false alarm? What is the customer impact?
- If there is an immediate fix available, make the fix
- If there is no immediate fix, bring in more people to help solve the problem
They can do this by looking at logs and metrics and examining the source code.
The on call engineer often doesn't fully understand the issues they are trying to investigate.
To solve this we provide runbooks which give step-by-step instructions on what to do if there is an issue with part of the service.
Incident management
POV: You are on call for your kahoot service, which is being used by real people - and you got alerted about a spike in 5XX errors.
You investigated the issue - looked at the logs, checked metrics, followed the runbook and still can't figure out what is going wrong. You are still getting more 5XX errors.
It's time to raise an incident. This process depends on your company - at Atlassian we call them HOTs.
An incident is an unplanned interruption or reduction to your quality of service. This incident can impact customers, revenue, or even safety in the worst case.
Incident management
Incident management is a a seperate topic - but in a nutshell, it involves:
- Bringing in team members who have the expertise to solve the issue
- Communicating with stakeholders (users) about progress fixing the issue
- Fixing the issue and making sure˛the fix has worked correctly
- Understanding the impact of what has broken
- Learning from mistakes through a Post-Incident Review
Some large-scale incidents span over days or even weeks, if customer agreements have been breached and the company needs to recover data or patch a major security issue.
TechOps
TechOps is a ritual where the team looks at the overall performance of their software over the last week. It is often done as a hand over between engineers on on-call shifts.
In the techops meeting, the team looks at things such as:
- Incidents that occurred during the week
- High priority alerts received (SLO breaches, major alarms)
- Low priority alerts recieved (small SLO burns, minor alarms)
- SLO performance
- Costs
- Security vulnerabilities
The team also comes up with action items to address or investigate issues identified during the ops meeting.
Cost Management
Your software likely has a series of costs that you also need to monitor and control. Costs include:
- Infrastructure costs (e.g. Vercel, Amazon Web Services)
- Logging or metrics service costs (e.g. Splunk)
- Git repository / CI costs (e.g. GitHub)
- LLM API costs (e.g. ChatGPT)
In university/small scale projects these are not as much of a concern, since you are using free tier versions, or are paid for by the university. As soon as you start building real software, you will need to consider costs.
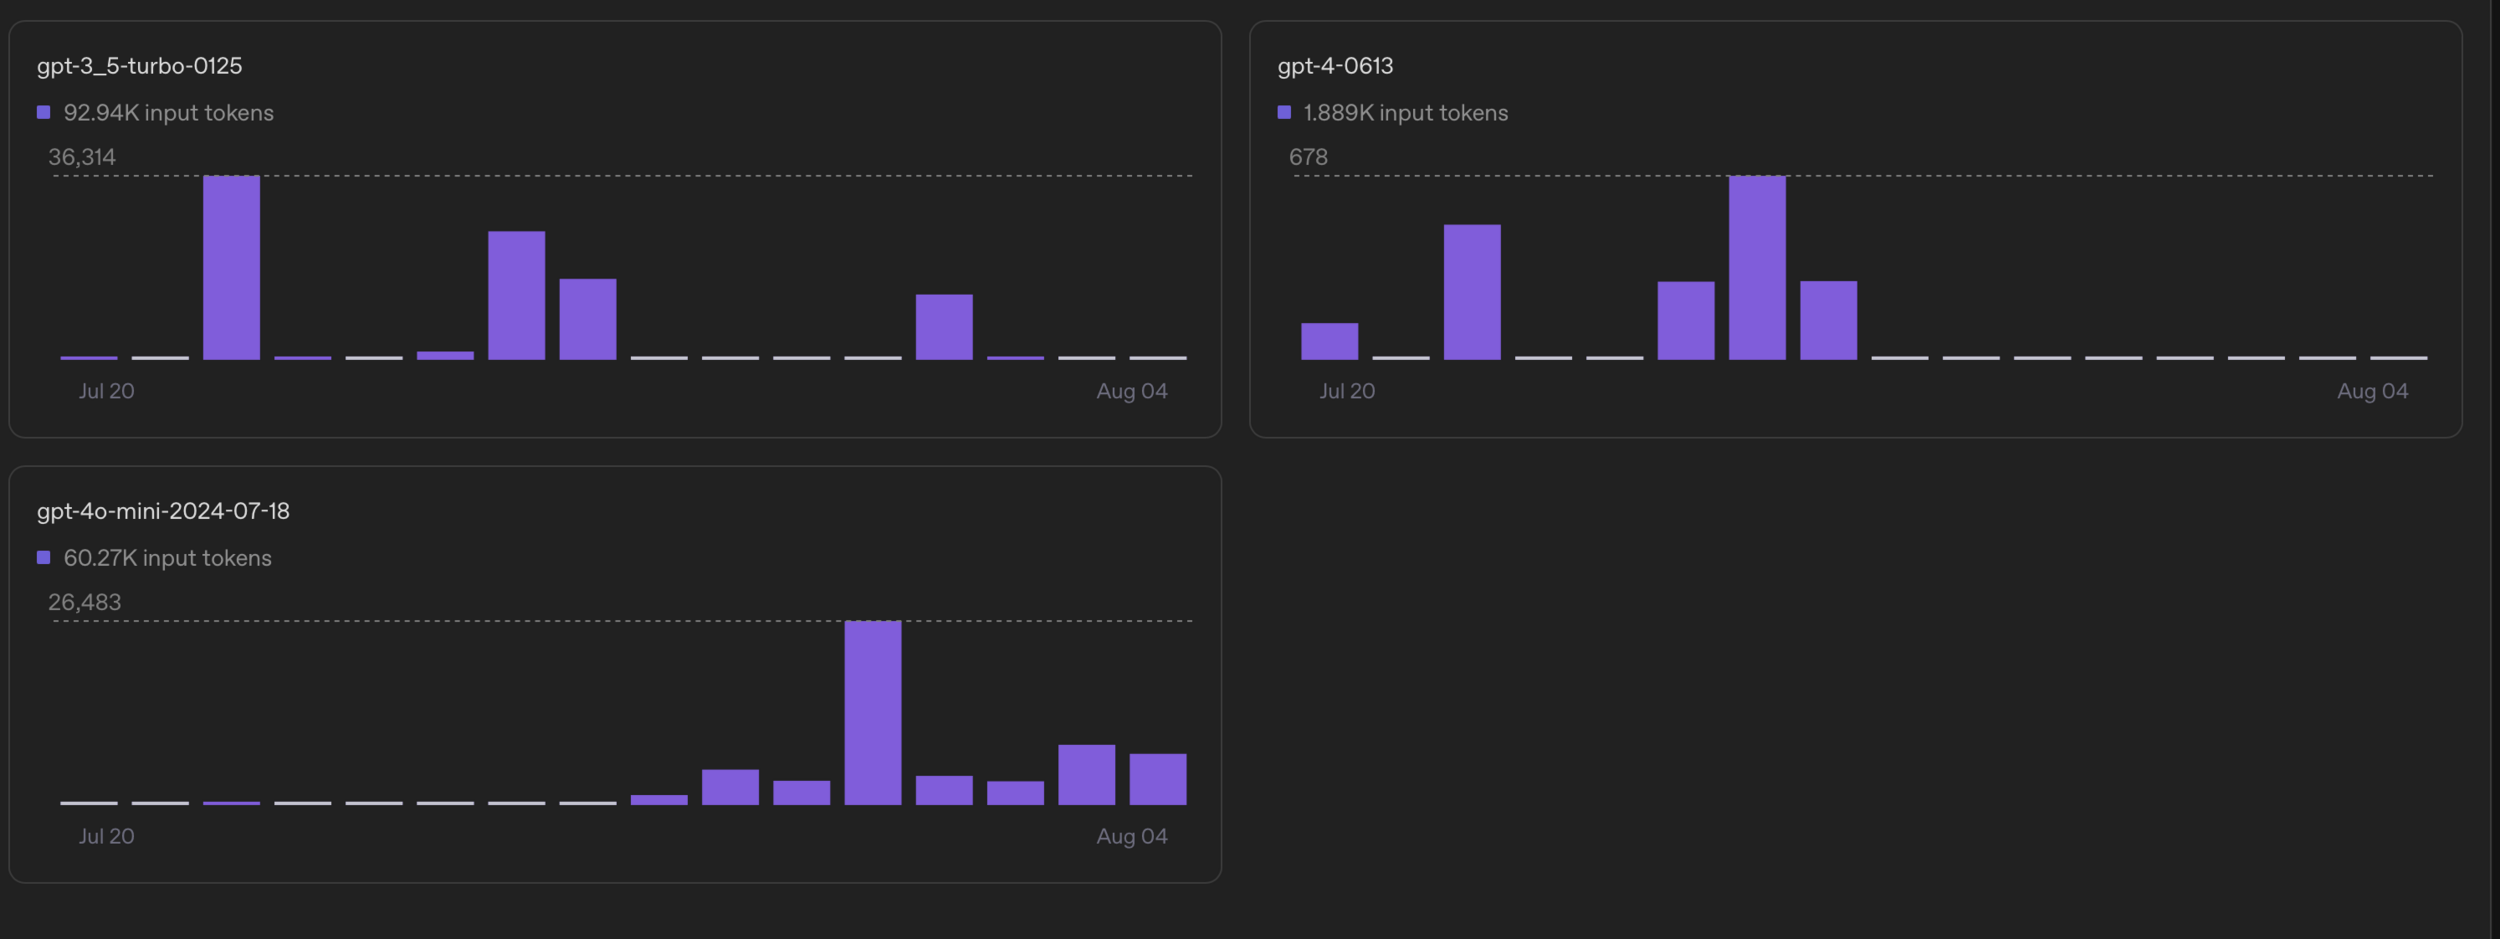
Costs should be monitored as part of the weekly techops ritual, and alerts should be in place for anything that might cause a spike in costs.
E.g. There is a spike in calls to your LLM API, which will cost you $$$ since you are charged per input token.

Vulnerability Management
Part of operating software is keeping it secure.
Your code will often rely on other code (NPM packages), which may have security vulnerabilities. When these are discovered and fixed, it's important to update your package versions.
The CVE (Common Vulnerabilities and Exposures) program is a US-government initiative which identifies and documents security vulnerabilities https://www.cve.org/
A well known recent CVE was the log4j vuln, a vulnerability in a Java library that allowed attackers the ability to arbitrarily execute code. https://nvd.nist.gov/vuln/detail/cve-2021-44228