


Content ITV PRO
This is Itvedant Content department
Learning Outcome
6
Identify techniques to reduce bias or variance.
5
Explain the Bias–Variance Tradeoff.
4
Understand how model complexity affects prediction error.
3
Explain the concepts of underfitting and overfitting.
2
Understand the meaning of Variance in machine learning.
1
Understand the meaning of Bias in machine learning.
Before understanding bias and variance, recall how models are evaluated.
When training machine learning models, we measure performance using:
Two common problems can occur:
Underfitting
Overfitting
The model is too simple and cannot capture the patterns in the dataset.
The model becomes too complex and memorizes the training data instead of learning general patterns.
Characteristics:
Characteristics:
High training error
High test error
Example:
Using a linear model to represent complex non-linear data.
Example:
A very deep decision tree or high-degree polynomial.
These problems are explained through the concepts of bias and variance.
Imagine you stand in an archery field.
A target sits in the distance.
You shoot several arrows.
First attempt.
All arrows land far from the center, but they land very close to each other.
Your aim is consistently wrong.
Second attempt.
Arrows land all over the target, scattered unpredictably.
Some close.
Some far.
Your aim is unstable.
Third attempt.
Arrows land close to the bullseye, tightly grouped.
Accurate.
Consistent.
Machine learning models behave the same way.
The goal is to build models that are accurate and stable.
Takeaway: Good models balance accuracy and stability.
The challenge is to find a model that balances bias and variance, achieving good performance on both training and unseen data.
This balance is known as the Bias–Variance Tradeoff.
Understanding Bias
Definition
Characteristics of high bias:
Model makes strong simplifying assumptions
High training error
High testing error
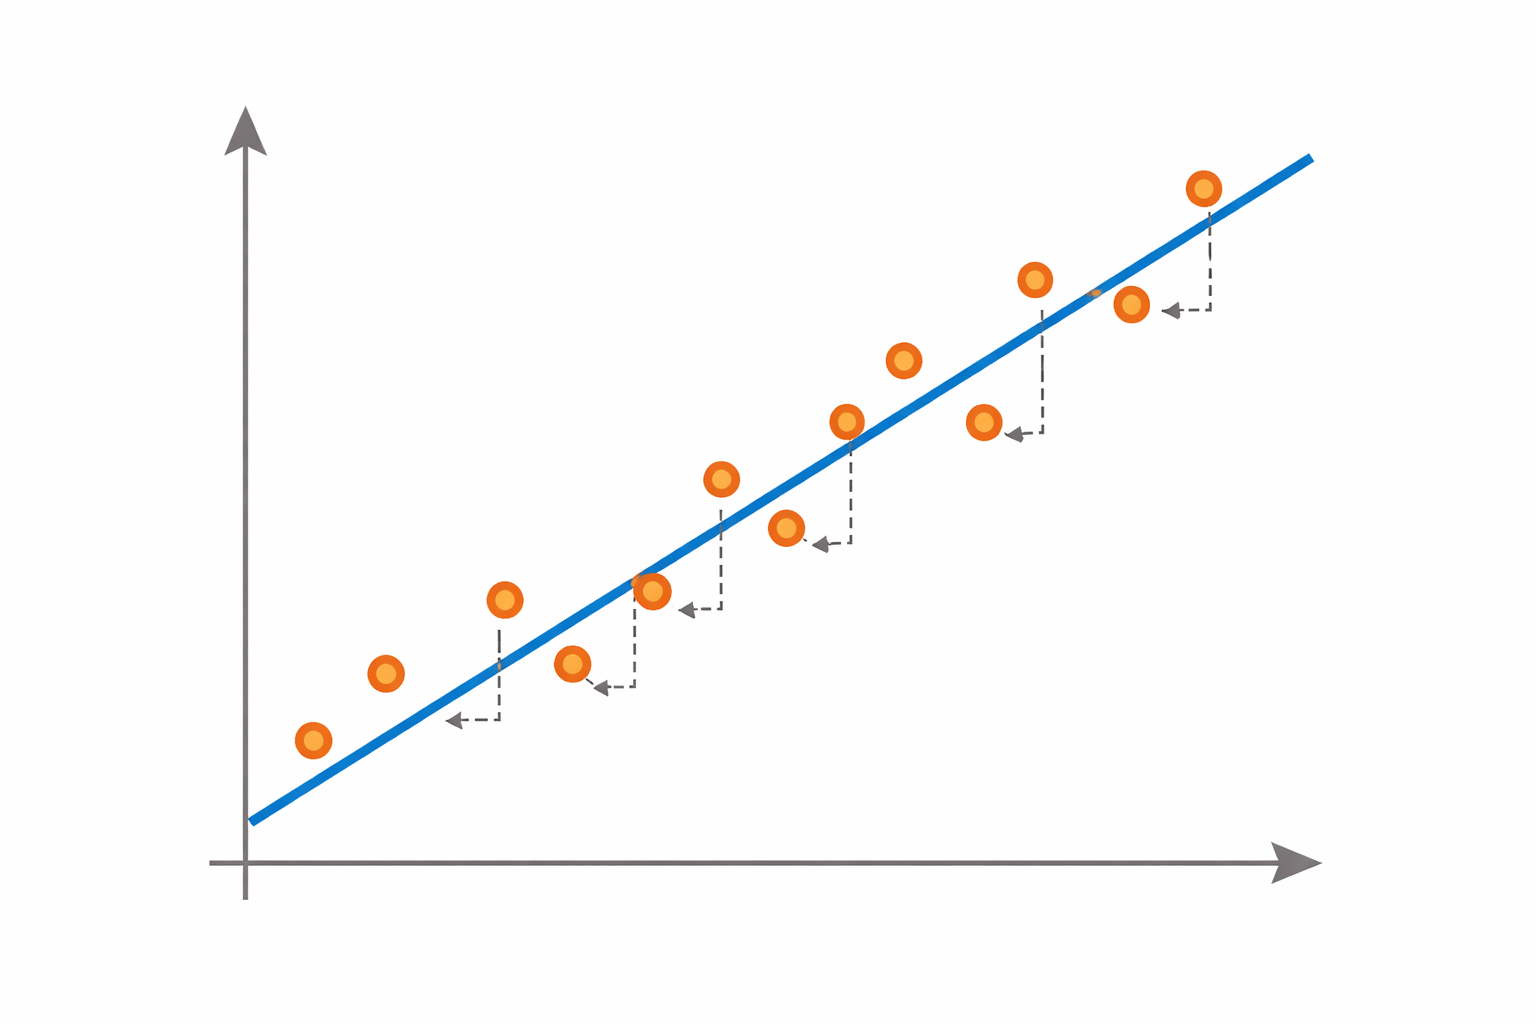
This situation results in underfitting.
Applying a straight-line model to nonlinear data.
Methods to Reduce Bias
Use more complex models
Increase model capacity
Add more relevant features
Include relevant predictors
Increase model flexibility
Reduce constraints
Example:
Definition
Variance measures how much the model's predictions change when the training dataset changes.
High variance occurs when a model is too complex.
Characteristics of high bias:
Very low training error
High test error
Model learns noise in the data
This Leads to Overfitting
Understanding Variance
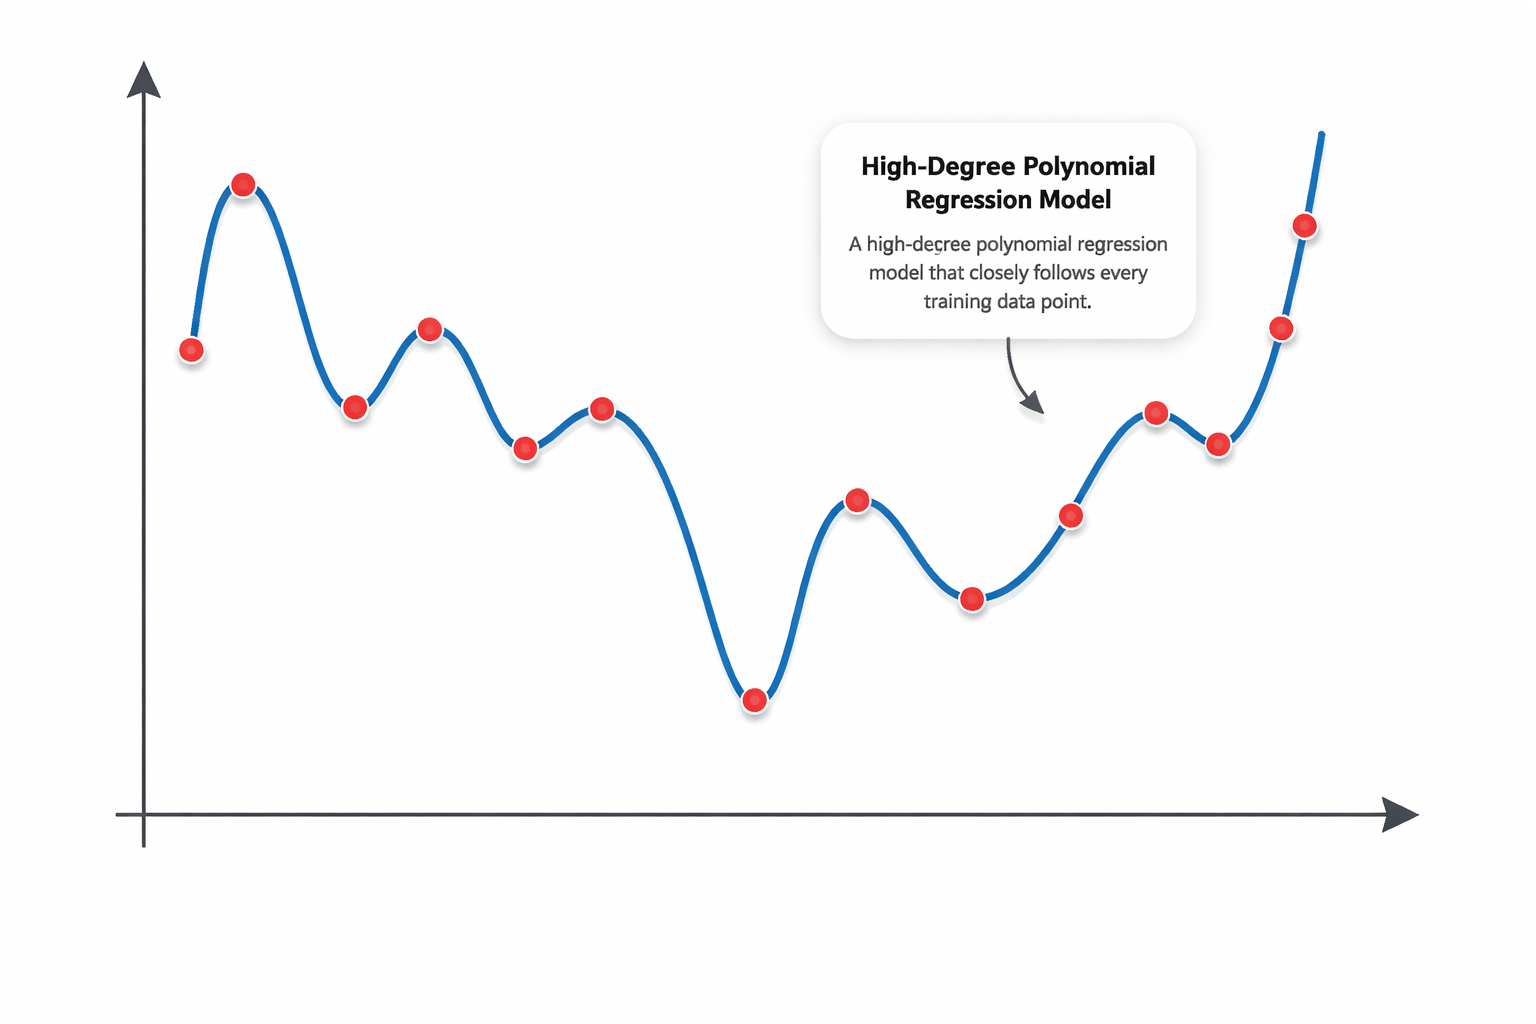
Example:
A high-degree polynomial regression model that closely follows every training data point.
Methods to Reduce Variance
Reduce model complexity
Use regularization techniques
Increase training data
Add penalty terms
More samples reduce sensitivity
Use ensemble methods such as bagging
Use bagging techniques
Simplify model structure
Total Prediction Error
The total prediction error of a model can be expressed as:
Total Error = Bias² + Variance + Irreducible Error
Where:
Bias²
error due to model assumptions
Variance
sensitivity to training data
Irreducible Error
noise in the data that cannot be removed
The goal of machine learning is to minimize Bias² + Variance.
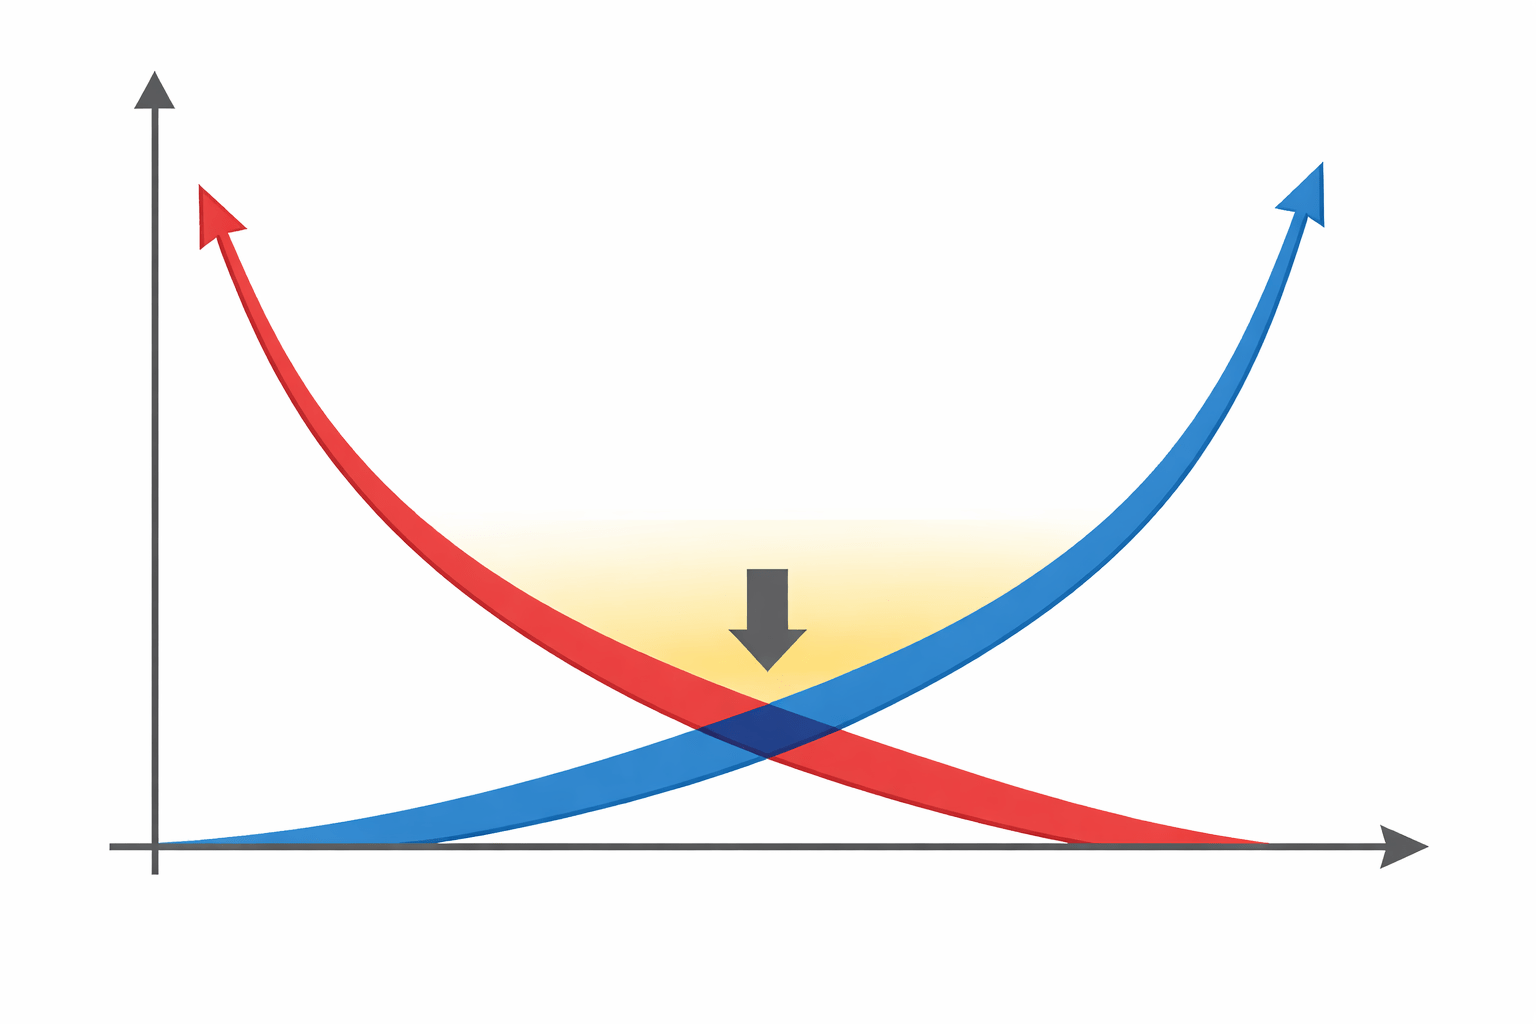
Bias–Variance Tradeoff
As model complexity changes:
The optimal model lies at the balance point where total error is minimized.
Increasing complexity
Bias
Variance
Decrease Complexity
Bias
Variance
Implementation in Python
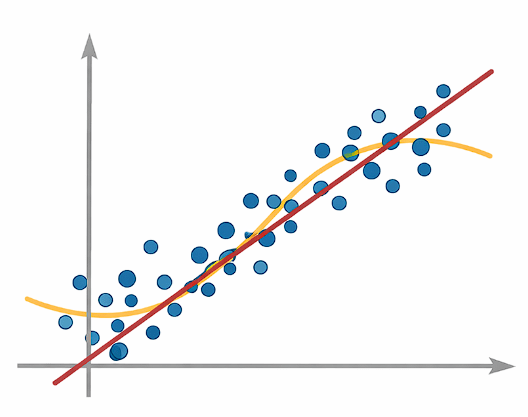
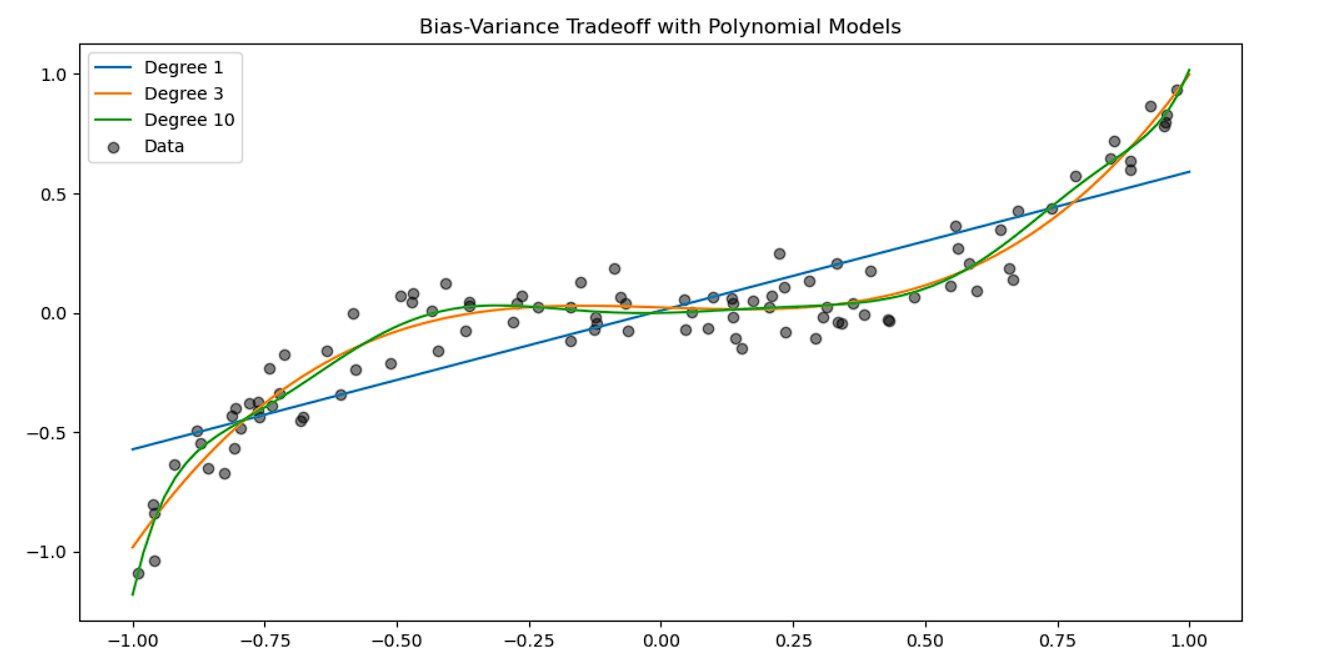
The bias–variance tradeoff can be visualized by fitting models with different complexities.
Step 1 — Import required libraries
import numpy as np
import matplotlib.pyplot as plt
from sklearn.linear_model import LinearRegression
from sklearn.preprocessing import PolynomialFeatures
Step 2 — Generate synthetic data
np.random.seed(0)

X = np.sort(np.random.rand(100, 1) * 2 - 1, axis=0)
y = X**3 + np.random.randn(100, 1) * 0.1
Explanation:
Step 3 — Generate test points for visualization
X_test = np.linspace(-1, 1, 100).reshape(-1, 1)These points help visualize how models behave across the input range.
Step 4 — Train models with different complexities
plt.figure(figsize=(12,6))
for degree in [1, 3, 10]:
    poly = PolynomialFeatures(degree)
    X_poly = poly.fit_transform(X)
    X_test_poly = poly.transform(X_test)
    model = LinearRegression()
    model.fit(X_poly, y)
    y_pred = model.predict(X_test_poly)
    plt.plot(X_test, y_pred,
    label=f"Degree {degree}")
plt.scatter(X, y, color='black',
alpha=0.5, label="Data")
plt.legend()
plt.title("Bias-Variance Tradeoff with Polynomial Models")
plt.show()
Interpretation:
Degree 1 model → High bias (underfitting)
Degree 3 model → Balanced bias and variance
Degree 10 model → High variance (overfitting)
This visualization demonstrates how increasing model complexity affects bias and variance.
Summary
5
High variance leads to overfitting
4
High bias leads to underfitting
3
Variance is error caused by overly complex models
2
Bias is error caused by overly simple models
1
Bias–Variance Tradeoff explains two main sources of model error
Quiz
High bias usually results in:
A. Overfitting
B. Underfitting
C. Data leakage
D. Feature scaling
Quiz-Answer
High bias usually results in:
A. Overfitting
B. Underfitting
C. Data leakage
D. Feature scaling
By Content ITV


