
Content ITV PRO
This is Itvedant Content department
Exploration of Commodity Market using MCX
Business Scenario
You have joined a financial research advisory firm as a Junior Commodity Analyst. Your desk is responsible for monitoring global raw material flows and domestic price action across India’s primary derivative exchange for physical commodities—the Multi Commodity Exchange of India (MCX).
With geopolitical tensions, currency shifts, and supply chain disruptions causing rapid price swings in raw materials like Crude Oil, Natural Gas, Gold, and Silver, retail and institutional clients are actively seeking ways to hedge risk or capture short-term trading opportunities. Your Head of Research has tasked you with setting up your market tracking terminal,
Pre-Lab Preparation
decoding contract specifications, analyzing intraday price momentum, and documenting potential trading setups for the firm's morning briefing.
Topic : Commodities market
1) Commodity categories (energy, metals, agriculture)
2) Spot vs futures
3) Clearing and settlement
4) Operational relevance of commodity trades
Task 1: Navigate Commodity Listings & Deconstruct Contracts
Segment Classification
1
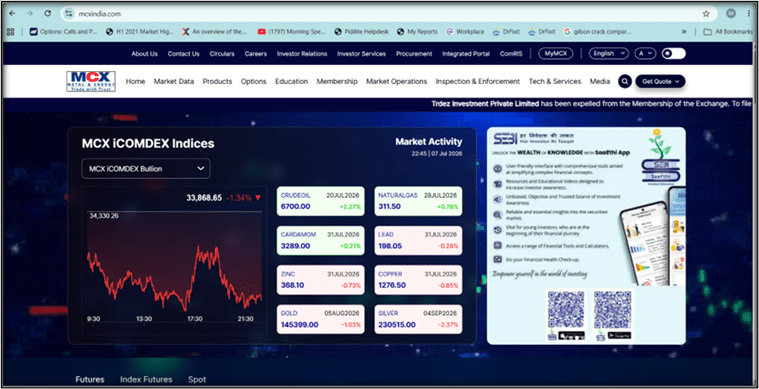
1. Go to the MCX Official Website:
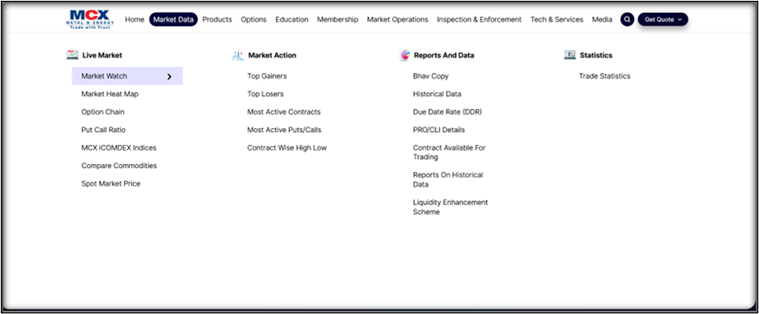
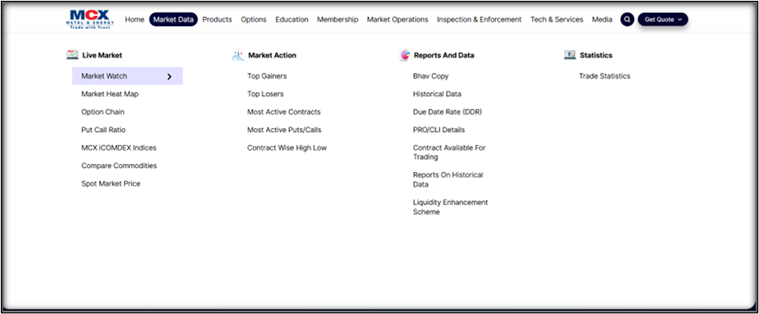
2. Find the Active Listings: Click on the Market Data tab at the top of the homepage, then select Market Watch from the menu.
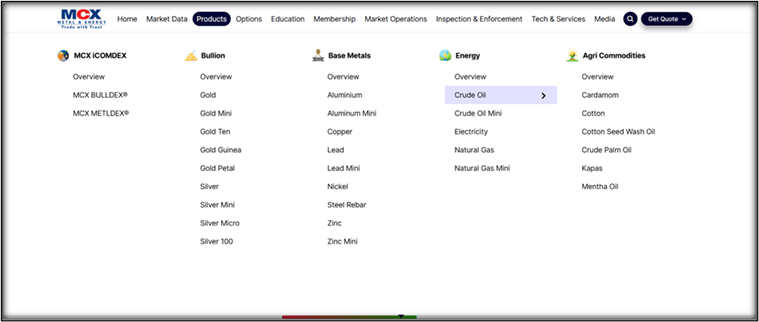
3. Observe Segment Classifications: Review the division of commodity listings into three primary active sectors:
Bullion: Gold, Gold Mini, Gold Guinea, Gold Petal, Silver, Silver Mini, Silver Micro.
Energy: Crude Oil, Crude Oil Mini, Natural Gas, Natural Gas Mini.
Base Metals: Aluminium, Copper, Zinc, Lead.
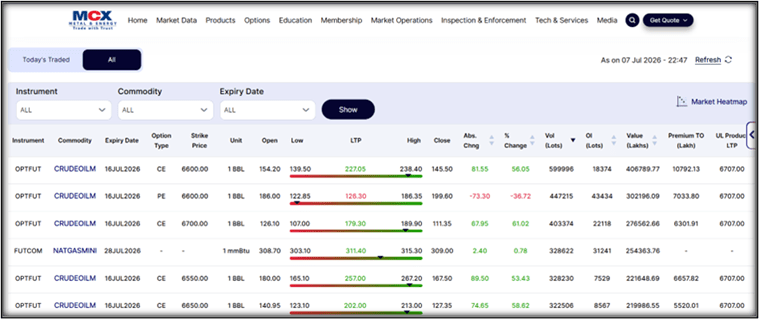
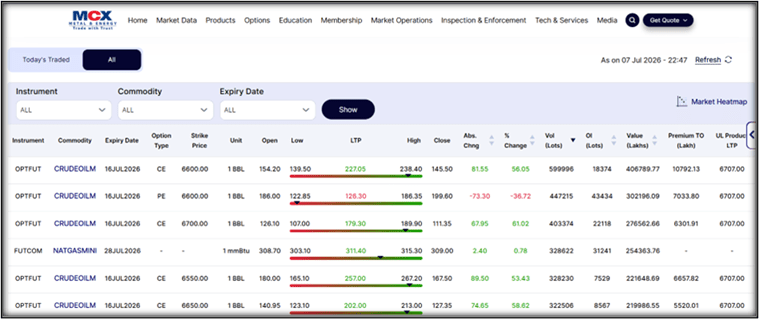
4. Sort by Liquidity: Click on the column header labeled Value (₹ Lakhs) or Volume (Lots). Identify the top 5 most liquid (active) contracts currently trading on the exchange (usually Crude Oil, Natural Gas, Gold, Silver, and Copper).
Decoding Contract Specifications
2
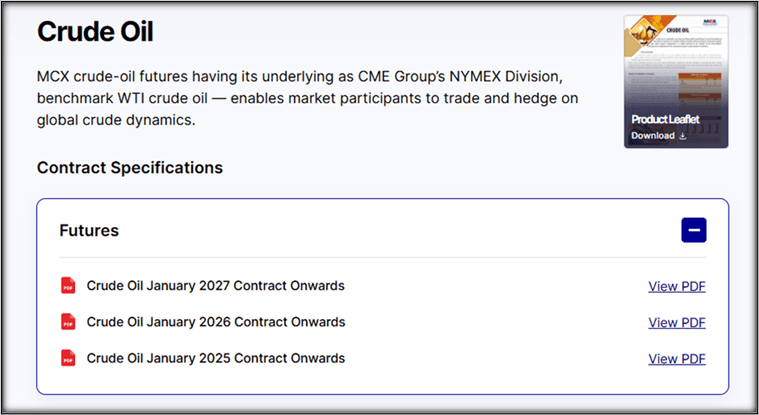
Note: Because these are master rulebooks, the specifications in these PDFs apply to all monthly contracts launched after the stated date, including your current July expiry month.
Lot Size (Trading Unit): Found in the master PDF (e.g., 100 Barrels for Crude Oil).
Tick Size (Minimum Price Movement): Found in the master PDF (e.g., ₹1.00 for Crude Oil).
Task 2: Analyze Price Movements & Market Breadth
1. Find the Active Listings: Click on the Market Data tab at the top of the homepage, then select Market Watch from the menu.
2. Sort by Liquidity: Click on the column header labeled Value (₹ Lakhs) or Volume (Lots). Identify the top 5 most liquid (active) contracts currently trading on the exchange (usually Crude Oil, Natural Gas, Gold, Silver, and Copper).
3. Reading Intraday Market Quote Markers
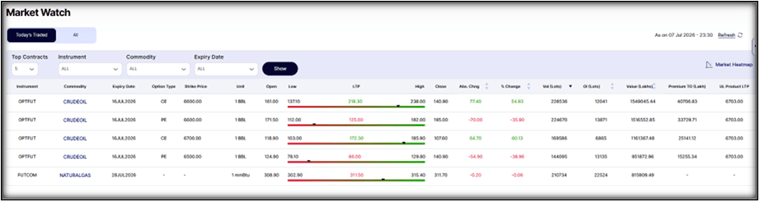
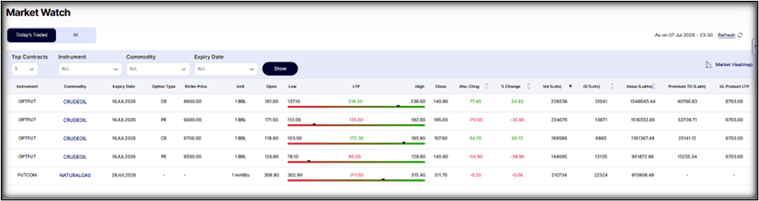
Based on the CRUDEOIL (16 JUL 2026) option contract data in your provided image, you can record the following operational price markers for your worksheet:
Previous Close: 140.90 (Note: In the quote table, the "Close" column represents the final reference price of the previous trading session).
Open: 161.00 (Note: This is the first traded price at which the contract opened for the current session).
High: 238.00 (Note: This is the extreme upper boundary reached by the price during the current session).
Low: 137.10 (Note: This is the extreme lower boundary reached by the price during the current session).
LTP (Last Traded Price): 218.30 (Note: This is the current live price at which the contract was last traded)
Task 3: Understanding Trading Opportunities
To understand market sentiment, you look at how the Price and Open Interest (OI) change together. Here is an easy-to-understand breakdown of these four scenarios using the Crude Oil contract data from your market watch.
Market Sentiment Diagnosis Guide:
| Scenario | What is happening? | Explanation |
|---|---|---|
| Long Buildup | Price⬆️+ OI ⬆️ | Aggressive Buying: New buyers are entering the market and taking long positions. This usually shows strong confidence that the price will keep rising. |
| Scenario | What is happening? | Explanation |
|---|---|---|
| Short Buildup | Price ⬇️+ OI ⬇️ | Aggressive Selling: New sellers are entering the market to "short" the commodity. This shows strong belief that the price will fall further. |
| Short Covering | Price ⬆️ + OI ⬇️ | Sellers Exiting: Those who previously sold (shorted) the commodity are buying it back to close their trades. Since they are buying to exit, the price goes up. |
| Long Unwinding | Price ⬇️ + OI ⬇️ | Buyers Exiting: Existing buyers are closing their profitable or losing trades. Since they are selling to exit, the price drops. |
How to Apply This to Your Crude Oil Example
To determine which scenario applies to your specific contract (e.g., CRUDEOIL 16JUL2026
CE 6600.00), you must compare its current status to the previous day:
For Long Buildup: If you see the price at ₹218.30 (up from yesterday) and the OI is higher than yesterday’s 12,041 lots, you have confirmed a Long Buildup.
For Short Buildup: If the price were to fall below yesterday’s close and the OI jumped above 12,041 lots, you would confirm a Short Buildup.
For Short Covering (Current Trend in Image): Your image shows a price jump of +54.93%. If you check your historical data and see that the OI has dropped below 12,041 lots compared to yesterday, it means the price rise is being driven by Short Covering—traders are rushing to close their "sell" positions.
For Long Unwinding: If the price were to drop and the OI fell below 12,041 lots, it would mean existing bulls are "unwinding" their positions by selling their contracts.
Activity
Contract Specification Audit
You must know the physical rules of the instrument you are trading.
1. Select one active MCX commodity: Crude Oil, Gold, Silver, Natural Gas, or Copper.
2. Document its Lot Size (Trading Unit) and Tick Size.
Congratulations on completing this lab!
You explored the MCX trading platform, analyzed commodity contract specifications, and interpreted price movements using market data. You also learned how to identify market sentiment through price and open interest (OI) analysis and recognized different trading scenarios such as Long Buildup, Short Buildup, Short Covering, and Long Unwinding. These concepts provide a strong foundation for commodity market analysis and trading.
Checkpoint
By Content ITV